Getting Started with the IBM Call for Code Disaster Resilience Starter

Earlier this month I blogged about our collaboration with IBM in their Call for Code initiative as a way to encourage developers to find ways to help fight both COVID-19 and climate change. I mentioned that IBM had created two starter kits and talked about some of the APIs and suggestions for the first one involving Community Collaboration. Today I'll walk you through the second starter kit, Disaster Resiliency and Climate Change.
The starter kit focuses on the problem of flooding and imagines an application that supports three unique modes. Before a flood occurs, the app provides resources to help people prepare for flooding. Once a flood occurs, the app switches to emergency mode and displays a route to an available shelter with capacity. The third stage of the app includes suggestions for rebuilding as well as serving as a platform for people to ask for and provide supplies.
As with the previous blog post, I'm going to provide some information and examples related to HERE Location Services that will work well with this starter. This isn't meant to be a finished solution, but merely a few examples of how the services work and how easy (hopefully!) they will be for you to implement. Let's begin with Routing.
Routing
In my last article I talked about our routing API and described how simple it was to get a path from one point to the other. While the API is flexible and can be used anywhere, what about an example on a map?
Let's start with a basic map:
        const KEY = 'your key here';
var platform = new H.service.Platform({
    'apikey': KEY
});

// Obtain the default map types from the platform object:
var defaultLayers = platform.createDefaultLayers();

var map = new H.Map(
    document.getElementById('mapContainer'),
    defaultLayers.vector.normal.map,
    {
        zoom: 5,
        center: { lat: 30.22, lng: -92.02 },
        pixelRatio: window.devicePixelRatio || 1
    }
);


var behavior = new H.mapevents.Behavior(new H.mapevents.MapEvents(map));

// Create the default UI:
var ui = H.ui.UI.createDefault(map, defaultLayers);
To add routing, you first add an instance of the routing service:
var router = platform.getRoutingService();
Then you define parameters for your route. There's a lot you can do here, but to make it simple I've just asked for the fastest route from Lafayette, Louisiana to New Orleans.
        var routingParameters = {
    // The routing mode:
    'mode': 'fastest;car',
    // The start point of the route:
    'waypoint0': 'geo!30.22,-92.02',
    // The end point of the route:
    'waypoint1': 'geo!29.95,-90.07',
    // To retrieve the shape of the route we choose the route
    // representation mode 'display'
    'representation': 'display'
};
Then you simply calculate the route, I say simply but the actual route calculation is petty simple:
        router.calculateRoute(routingParameters, result => {

}, e => {

});
Of course, working with the result takes a bit more work. The result will contain information that lets you plot the route on the map. Here's that portion:
        let route, routeShape, startPoint, endPoint, linestring;
if(!result.response.route) return;

// Pick the first route from the response:
route = result.response.route[0];
// Pick the route's shape:
routeShape = route.shape;

// Create a linestring to use as a point source for the route line
linestring = new H.geo.LineString();

// Push all the points in the shape into the linestring:
routeShape.forEach(function(point) {
    var parts = point.split(',');
    linestring.pushLatLngAlt(parts[0], parts[1]);
});

// Retrieve the mapped positions of the requested waypoints:
startPoint = route.waypoint[0].mappedPosition;
endPoint = route.waypoint[1].mappedPosition;

// Create a polyline to display the route:
var routeLine = new H.map.Polyline(linestring, {
    style: { strokeColor: 'blue', lineWidth: 3 }
});

// Create a marker for the start point:
var startMarker = new H.map.Marker({
    lat: startPoint.latitude,
    lng: startPoint.longitude
});

// Create a marker for the end point:
var endMarker = new H.map.Marker({
    lat: endPoint.latitude,
    lng: endPoint.longitude
});

// Add the route polyline and the two markers to the map:
map.addObjects([routeLine, startMarker, endMarker]);

// Set the map's viewport to make the whole route visible:
map.getViewModel().setLookAtData({bounds: routeLine.getBoundingBox()});
That's quite a bit, but the comments should make it clear what's going on. We work with the first result (our service may return multiple routes) and create a "line" object. This line is filled with the result data from the route. Then we add markers to the beginning and end of the route to make it even more clear. This is all added to the map and then we "reset" the map view to ensure you can see the complete route. Here's how it looks:
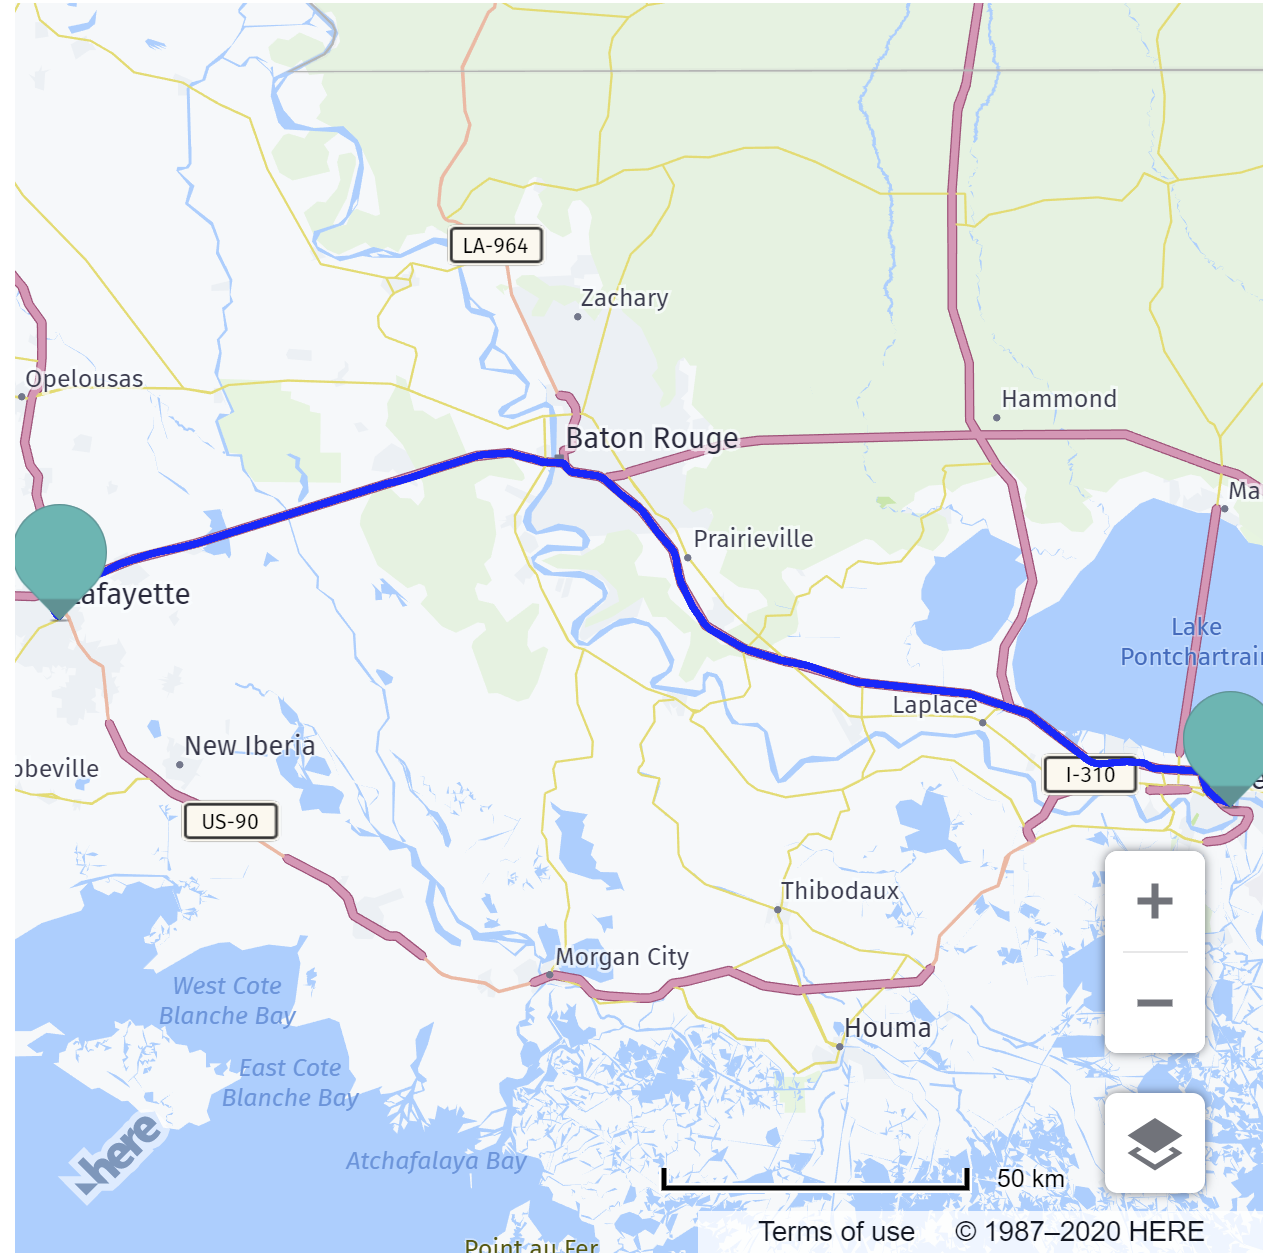
You can find the complete source for this demo here.
Maps with Markers
Another aspect that would be useful for this starter (and the previous one) is adding markers to a map. Luckily this is incredibly simple to do. In fact, you can do it in one line of code:
map.addObject(new H.map.Marker({lat:30.9087, lng:-92.1079}));
Markers can be customized of course (check out out docs for examples of this), but if you're ok with the default marker style and size, it's as simple as specifying a location. Here's an example with a dynamic set of markers. (Well to be clear, the set is hard coded, but you could imagine this coming from a third party API.)
        let locations = [
    { lat: 31.22, lng: -91.02 },
    { lat: 30.22, lng: -88.02 },
    { lat: 29.22, lng: -89.02 },
    { lat: 28.22, lng: -88.02 },
    { lat: 27.22, lng: -94.02 },

];

locations.forEach(l => {
    map.addObject(new H.map.Marker(l));
});
Here's how it looks:
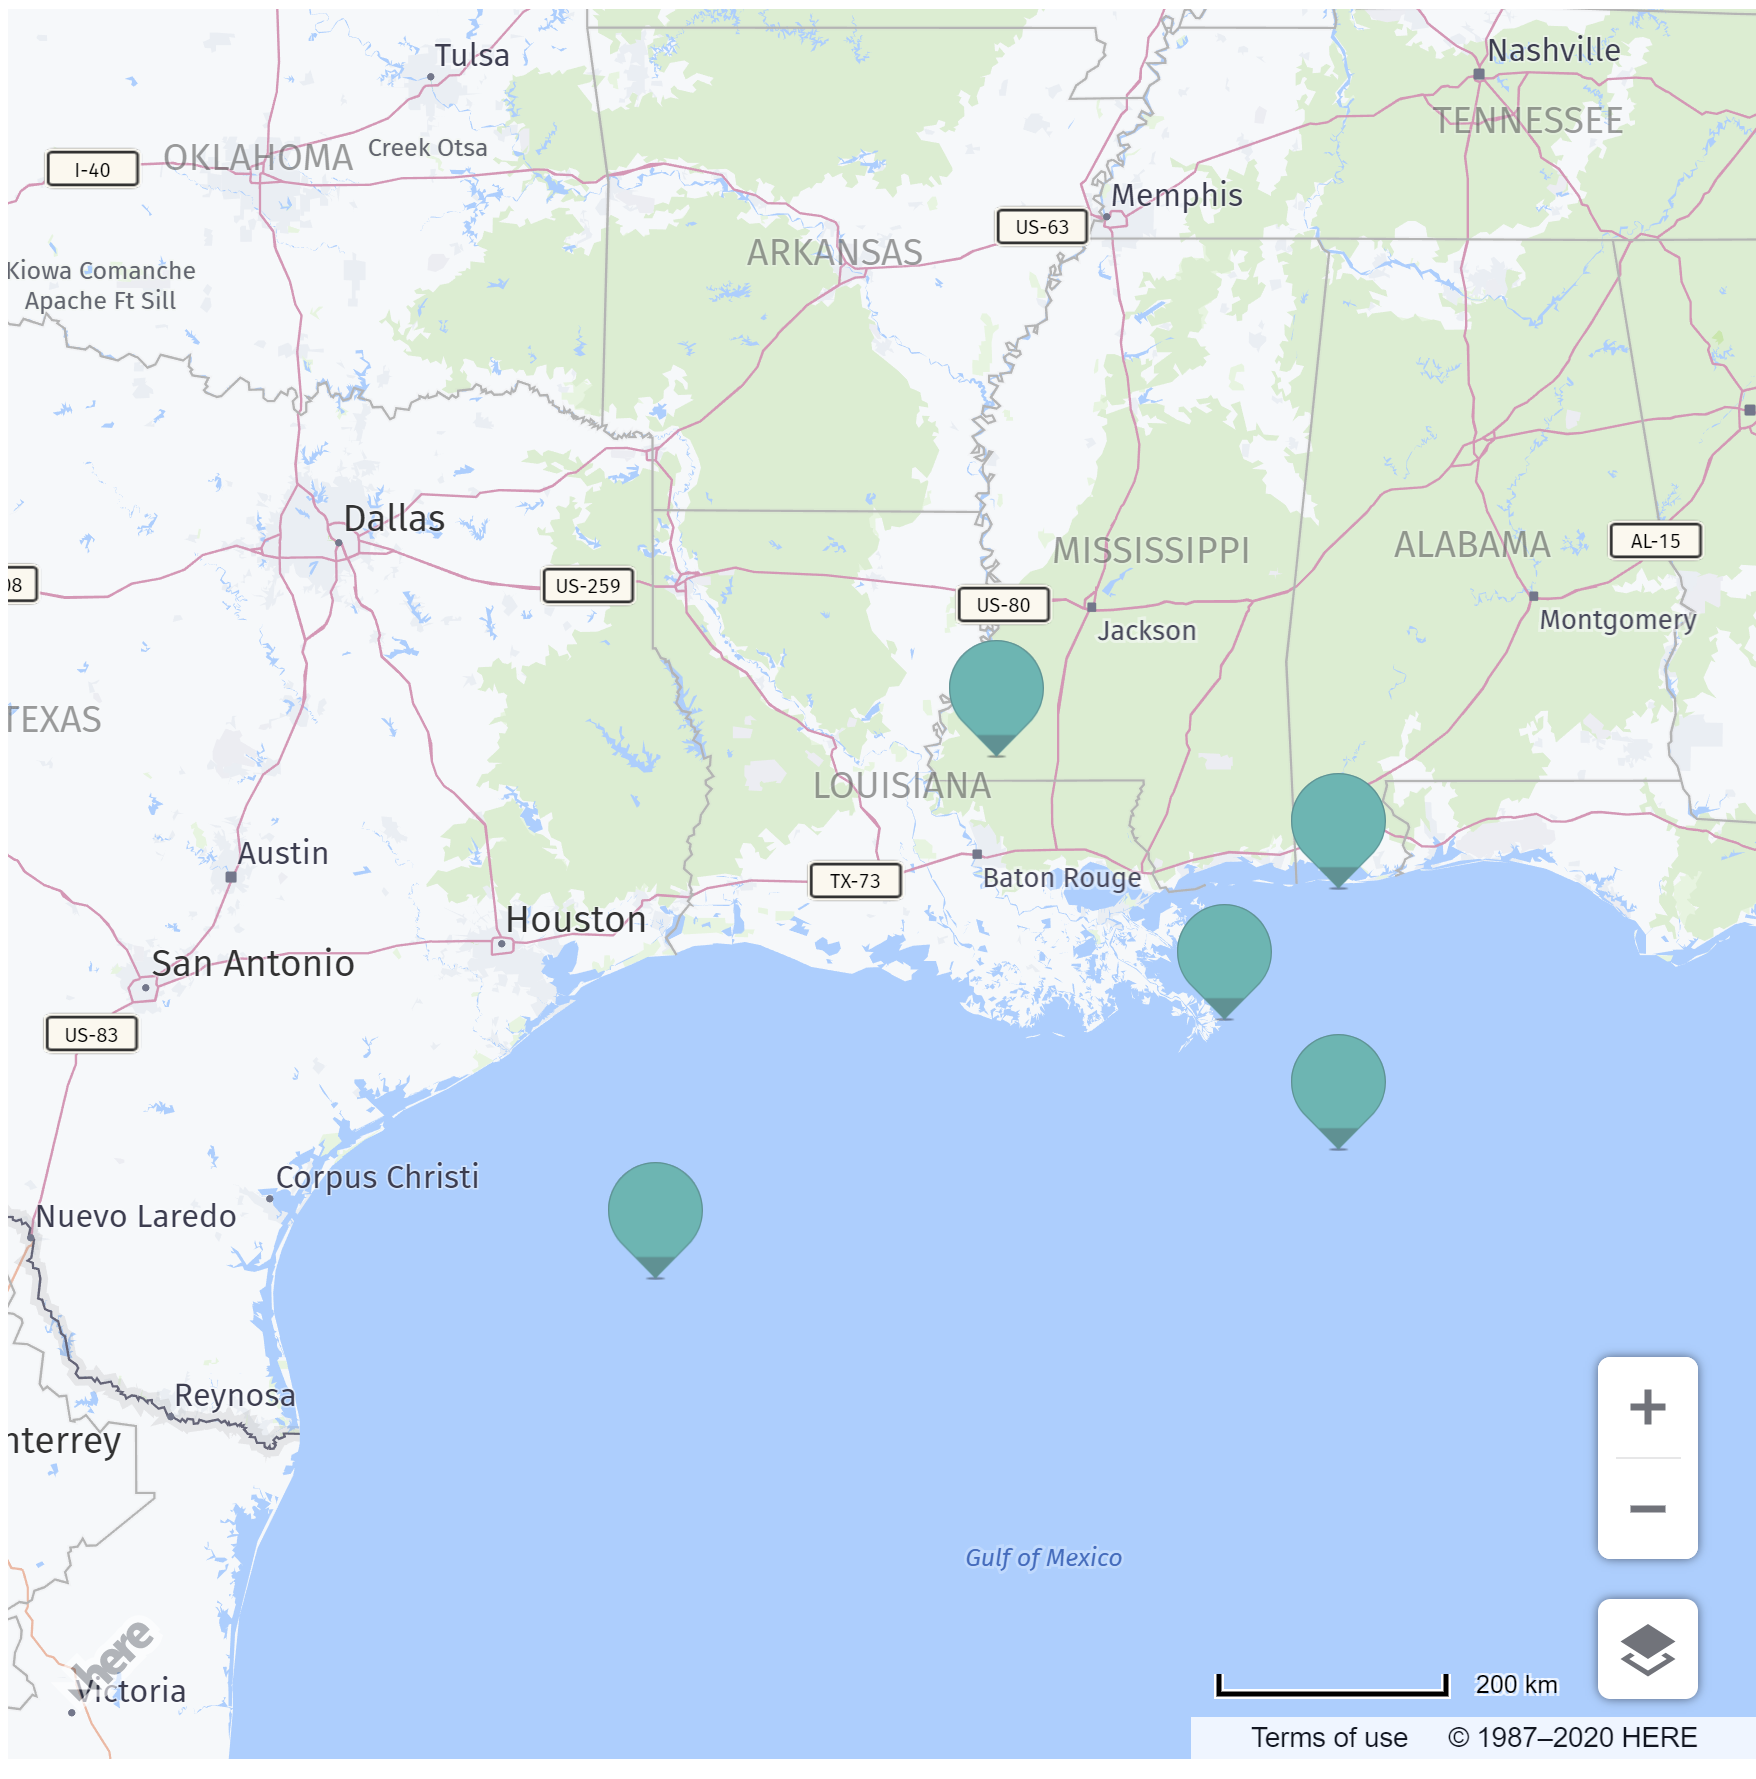
You can find the complete source for this example here.
Don't forget that if you need to store geospatial data, you should consider looking at Data Hub. It's got great APIs for working with this kind of data and our JavaScript Maps have built-in support for it!
Getting the Weather
The starter mentions the excellent IBM service for getting weather data, you may also want to take a look at our Destination Weather API. This API provides current conditions, forecasts, and information about any weather alerts (like flooding).
You can ask for weather information using a latitude and longitude, a zip code, or a name. Here's a simple example for the current weather at my location:
This returns an array of observations based on the name value. If you look at the first response only, you've got a lot of data:
        {
  "observation": [
    {
      "daylight": "D",
      "description": "Mostly cloudy. Warm.",
      "skyInfo": "16",
      "skyDescription": "Mostly cloudy",
      "temperature": "25.61",
      "temperatureDesc": "Warm",
      "comfort": "26.83",
      "highTemperature": "27.90",
      "lowTemperature": "22.70",
      "humidity": "74",
      "dewPoint": "20.61",
      "precipitation1H": "*",
      "precipitation3H": "*",
      "precipitation6H": "*",
      "precipitation12H": "*",
      "precipitation24H": "*",
      "precipitationDesc": "",
      "airInfo": "*",
      "airDescription": "",
      "windSpeed": "16.68",
      "windDirection": "170",
      "windDesc": "South",
      "windDescShort": "S",
      "barometerPressure": "1014.60",
      "barometerTrend": "",
      "visibility": "16.09",
      "snowCover": "*",
      "icon": "6",
      "iconName": "mostly_cloudy",
      "iconLink": "https://weather.ls.hereapi.com/static/weather/icon/17.png",
      "ageMinutes": "15",
      "activeAlerts": "15",
      "country": "United States",
      "state": "Louisiana",
      "city": "Lafayette",
      "latitude": 30.2241,
      "longitude": -92.0198,
      "distance": 3.74,
      "elevation": 11,
      "utcTime": "2020-05-15T11:53:00.000-05:00"
    }
  ],
  "country": "United States",
  "state": "Louisiana",
  "city": "Lafayette",
  "latitude": 30.22409,
  "longitude": -92.01984,
  "distance": 0,
  "timezone": -6
}
Check out the docs for more information, but I'll share a quick tip for my American readers - add &metric=false to return Imperial values. (Sorry, as much as I've tried to I can't "learn" Celsius!)
I hope this has been useful for folks considering taking up the Call for Code. On Friday, May 22nd at 12PM EST, IBM is hosting a livestream and I'll be on it. Here's more information:
Join here: https://developer.ibm.com/livestream/

Have your say
Sign up for our newsletter
Why sign up:
- Latest offers and discounts
- Tailored content delivered weekly
- Exclusive events
- One click to unsubscribe