Interactive Visualization of 10M+ 3D Points with New Open-Source Python Package PPTK
At HERE, we are continually pushing the speed and accuracy of automatic algorithms for extracting map features from 2D/3D point clouds such as GPS trajectories and LIDAR point clouds. To better work with data at this scale, engineers at HERE have developed a 3D point cloud viewer capable of interactively visualizing 10-100M 3D points directly in Python. This viewer is now included as part of a new open-source Python package called the Point Processing Tool Kit (PPTK).
In prototyping algorithms for this type of data, we are often faced with the need to quickly iterate between writing code and visualizing the results of applying such code. The Python programming language’s interactivity, conciseness, and vast collection of third-party packages allow us to implement sophisticated processing of point data in just a few lines of code, but it currently lacks support for interactively visualizing larger point clouds natively, such as the tens of millions of LIDAR points that HERE 3D mapping vehicles can produce every minute, or the millions of GPS trajectories that happen every day. That's where PPTK comes in.
Level of detail rendering for interactive visualization
Upon being called, the PPTK viewer organizes the input points into an octree. The octree is a tree data structure that represents a recursive partitioning of 3D space into increasingly smaller sized cubes. As the 3D viewpoint is being manipulated, the viewer uses this octree to approximate groups of faraway points as single points and to cull points that are outside the view frustum, thus greatly reducing the number of points that need to be rendered. Once the viewpoint is no longer being changed, the viewer then performs an exact rendering of all the point.
Point selection for data inspection and annotation
The PPTK viewer supports coloring of points by per-point attributes, which is useful for visualizing, for example, the per-point probabilities computed by a classification algorithm, or the partitioning of points computed by a segmentation algorithm. The viewer also supports single point selection or box selection for selecting multiple points. The selected points can then be queried using the viewer.get() method in Python. This is useful for annotation tasks required in creating training data for machine learning algorithms.
Agnostic to file format
The PPTK viewer is not tied to a specific file format. The user may leverage one of many existing Python packages for reading from any of a number of file formats commonly encountered for storing point data (e.g. .ply, .csv, .las, etc.). Once loaded into a numpy array, the points can then be directly visualized using the pptk.viewer() function.
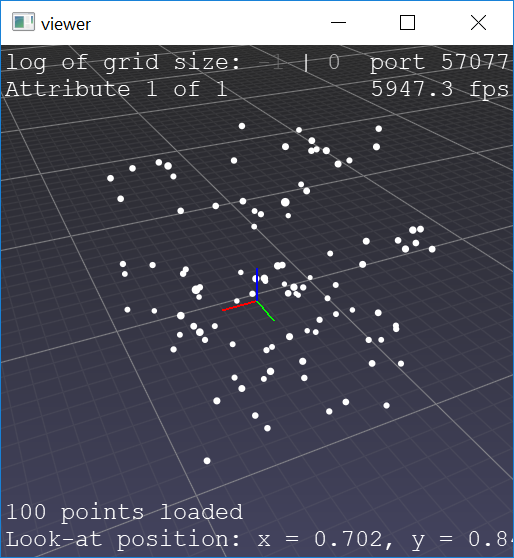
Quick startOn most platforms, PPTK is easy to install.
>> pip install pptk
In just a few lines of code, users can start viewing simple point clouds.
>> import numpy
>> import pptk
>> P = numpy.random.rand(100, 3)
>> v = pptk.viewer(P)
>> v.set(point_size=0.01)
Select points using Ctrl+LMB and deselect using Ctrl+Shift+LMB.
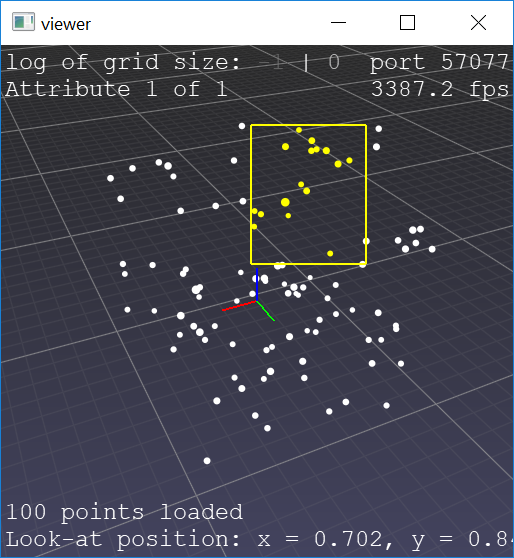
Retrieve the selected points using the viewer.get() method
>> v.get(‘selected’)
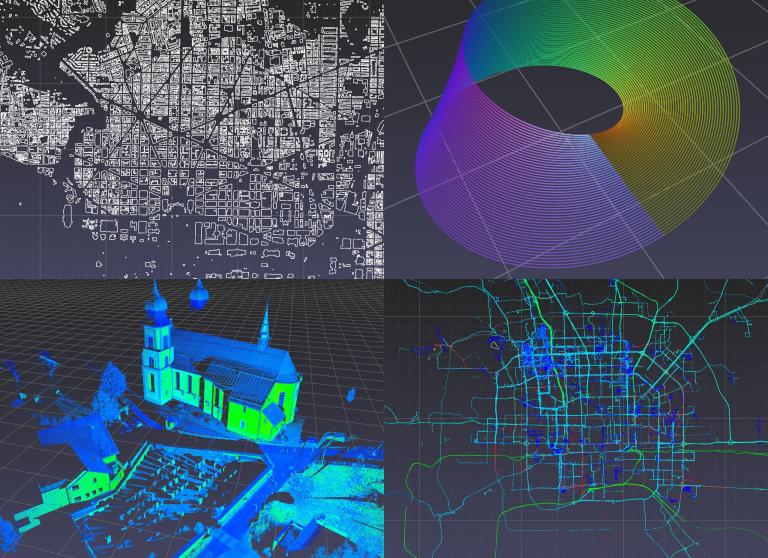
Check out the tutorials for some more advanced examples including lidar point clouds, GPS trajectories, 2D polygons, and parametric surfaces to generate visuals like these:
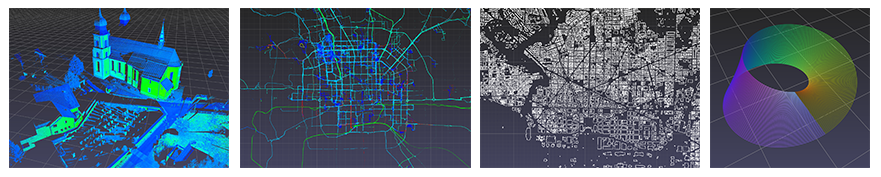
The bildstein1 Lidar point cloud from Semantic3D (left). Beijing GPS trajectories from Geolife (middle left). DistrictofColumbia.geojson 2-d polygons from US building footprints (middle right). A Mobius strip (right).
Future workThe PPTK viewer is part of a larger effort of developing a Python toolkit for not only visualizing but also processing point data. Already, PPTK provides a fully-parallelized k-d tree and a normal estimation routine. And existing Python packages, such as Numpy for matrix operations, and Tensorflow and PyTorch for deep learning, are also useful for processing point data. However, many point processing algorithms still suffer from significant performance penalties when written purely in Python, especially those that must loop over all neighborhoods in a point cloud. As we continue to grow PPTK, we hope to continue addressing these inefficiencies (e.g. via Python bindings to C++ implementations of common point cloud algorithms)
Git repository: https://github.com/heremaps/pptk
Documentation: https://heremaps.github.io/pptk/index.html
Installation: pip install pptk

Sign up for our newsletter
Why sign up:
- Latest offers and discounts
- Tailored content delivered weekly
- Exclusive events
- One click to unsubscribe