How to Create Floating Map Markers

This blog post is quick tutorial on how to create map markers to hover over the map. We will be creating map markers whose height and color will indicate the incline of a road up a mountain to demonstrate this. Let’s get started!
Step 0: Spoiler Alert
If you just like to see some code, you can check out the complete code for this post on GitHub. If you want to see what the end result looks like before you get started, you can see the code running here.
Also, if you came here just to quickly find out how to add an altitude to a marker, check out the code snippet below. It’s as simple as adding an altitude value (in meters) when creating a marker. However, keep reading if you want to learn how to use this feature in a neat looking project.
let altitudeMarker = new H.map.Marker({lat: 47.1, lng: 39.81, alt: 200 });
Step 1: Create a basic map
To add markers to a map, you first need a map. There’s a variety of ways you can set one up. For example, you can use another one of my blog posts called “How to Create a Web Map Application in Under Six Minutes”. You can also follow our getting started guide, open an example in JSFiddle or simply fork our JavaScript examples.
Personally, I have created my own clean full-screen map project in GitHub, which I use as a basis for projects like this. Forking that is probably the easiest way to get going. Remember that you will need an API Key for this, so sign up for your Freemium account to grab one.
Note that for this project we want to default to a satellite image view, so be sure to set the correct map layer during map initialization.
var map = new H.Map(document.getElementById('map'),
  defaultLayers.raster.satellite.map, {
  pixelRatio: window.devicePixelRatio || 1
});
Step 2: Getting a Route
Next, we need to get a route with altitude information as a basis for our markers. I have chosen the Mauna Kea Access Road on Hawaii. The waypoints below reflect the start of the road and the top of Mauna Kea. Since this isn’t a tutorial on the Routing API, I will just point out that we need the route shape returned to get locations for the markers. We also need to explicitly request altitude values, as the Routing API does not return these by default.
function calculateRouteFromAtoB(platform) {
  let router = platform.getRoutingService();
  let routeRequestParams = {
    mode: 'shortest;car',
    representation: 'display',
    routeattributes: 'shape',
    waypoint0: '19.68976,-155.46648',
    waypoint1: '19.82185,-155.47435',
    // request altitudes for positions
    returnElevation: true
  };

  router.calculateRoute(
    routeRequestParams,
    onSuccess,
    onError
  );
}
Step 3: Determining minimum and maximum altitude
We want to color code our markers based on relative altitude. The lowest marker should be colored green, the highest red. This mean we need to determine the minimum and maximum altitudes of any points in the shape of the route. We can do this by simply iterating over all the points in the route shape, which gets returned on the onSuccess callback of our Routing API call.
let minAltitude = 9999;
let maxAltitude = -9999;

routeShape.forEach(function (point) {
  let splits = point.split(',');
  if (splits[2] < minAltitude) minAltitude = splits[2];
  if (splits[2] > maxAltitude) maxAltitude = splits[2];
});
Step 4: Create SVG for the marker icon
To create our color-coded markers, we set up an SVG icon and then replace the color in the SVG string based on the relative altitude of each point. Once again, we iterate over the route shape.
First, we create a scaling factor for the marker color, based on the minimum and maximum altitude we determined in the previous step. Then we use this factor to create and RGB color screen, which we finally convert to the hex value needed in our SVG string. Finally, we create the SVG as a small circle and replace the color in the string.
Note that we also create a lineString using the points in the route shape. We do this so we can later add a polygon with the route on the map. This allows us to compare our markers with altitude to the route on the map.
  routeShape.forEach(function (point) {

    let splits = point.split(','); // lat, long, altitude
    routeLineString.pushLatLngAlt(splits[0], splits[1]);

    // Step 4: create RGB color in hex for SVG
    var scale = (splits[2] - minAltitude) / (maxAltitude - minAltitude);
    var red = Math.round(255 * scale);
    var red = red.toString(16);
    if (red.length == 1) {
      red = '0' + red;
    }

    var green = Math.round(255 - 255 * scale);
    var green = green.toString(16);
    if (green.length == 1) {
      green = '0' + green;
    }
    let blue = "00";
    let color = '#' + red + green + blue;

    let svg = '';
    svg = svg.replace('{$COLOR}', color);
Step 5: Create the markers
With our SVG image for the marker all set up, we can finally create a marker icon using the SVG string and then create the marker itself, passing not only the usual latitude and longitude, but also an altitude (as described in Step 0).
We also create our Polyline object for comparison and add both to the map.
    let altitudeIcon = new H.map.Icon(svg);
    let altitudeMarker = new H.map.Marker(
      {
        lat: splits[0],
        lng: splits[1],
        alt: splits[2]
      },
      { icon: altitudeIcon }
    );
    group.addObject(altitudeMarker);
  });

  polyline = new H.map.Polyline(routeLineString, {
    style: {
      lineWidth: 5,
      strokeColor: '#00AFAA'
    }
  });

  // Add the polyline to the map
  map.addObject(polyline);
  // Add markers to the map
  map.addObject(group);
  // Zoom to its bounding rectangle
  map.getViewModel().setLookAtData({
    bounds: polyline.getBoundingBox(),
    tilt: 50
  });
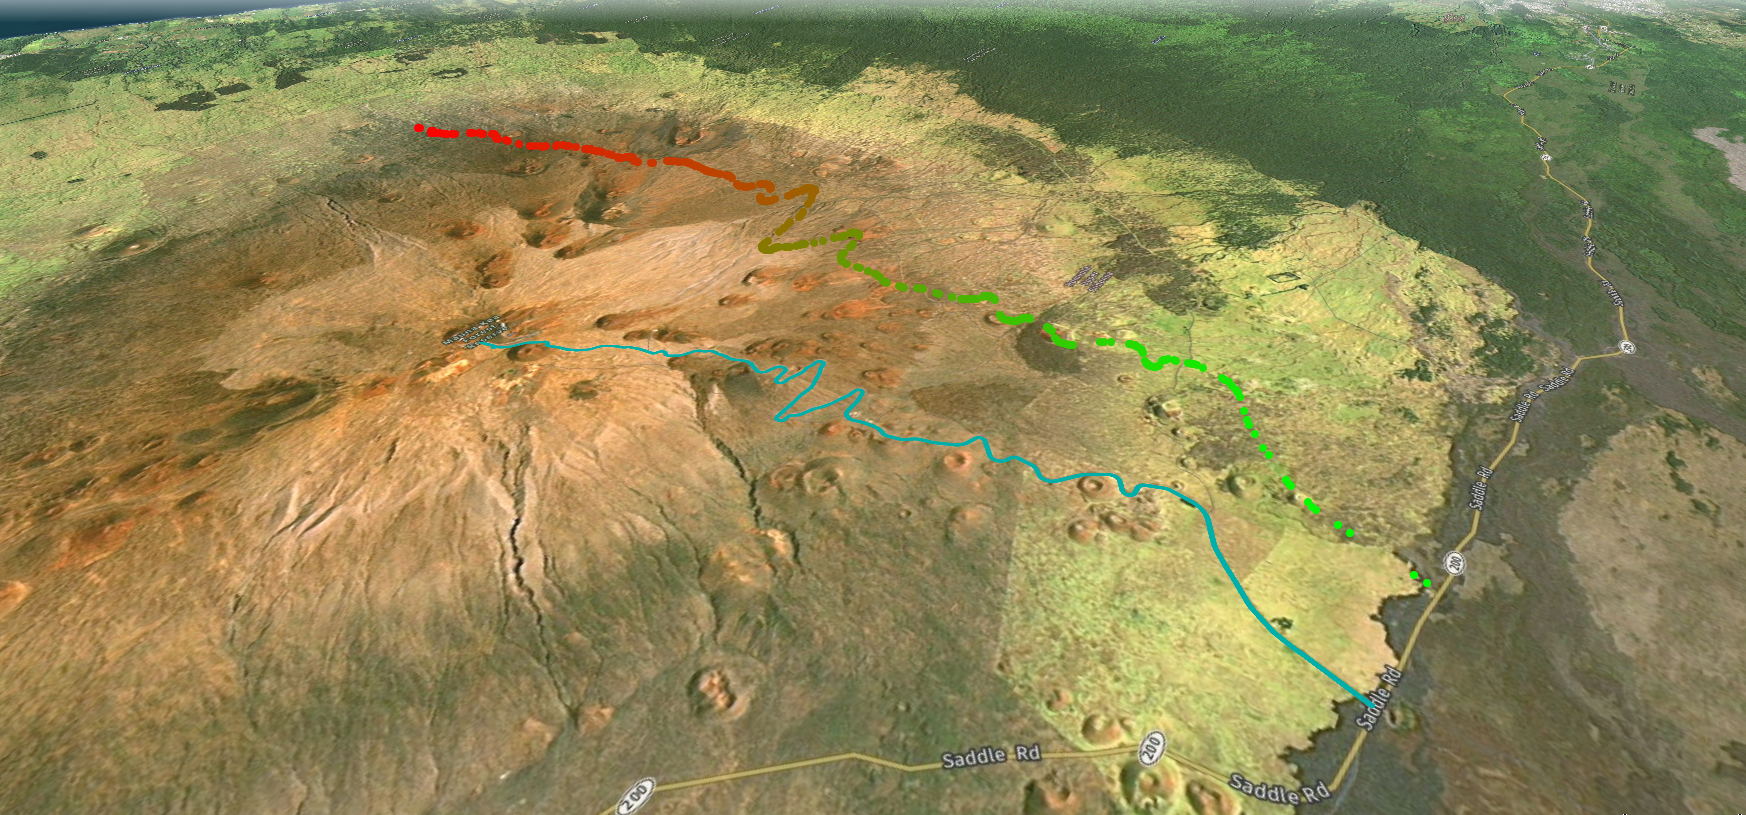
The final result should look something like the image below. However, this is best viewed in action, so check out the running example here. Be sure to hold down the ALT key and rotate/tilt the camera for the full effect.
Before you leave, don’t forget to have a look at the complete project code on GitHub!

Sign up for our newsletter
Why sign up:
- Latest offers and discounts
- Tailored content delivered weekly
- Exclusive events
- One click to unsubscribe