APIs
Benchmarking how LLMs use location tools
Piyush Pelagade — 14 October 2026
16 min read
04 September 2026
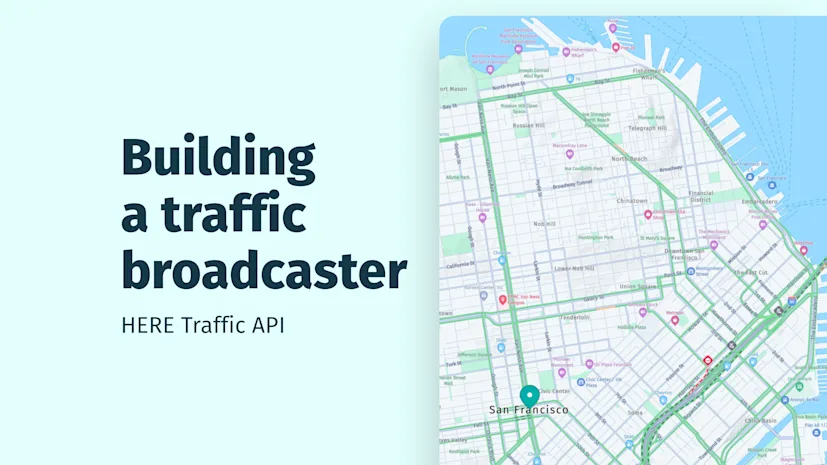
Most traffic applications visualize congestion on a map. But what if your users never look at a map?
Traffic information may need to reach a driver listening to a radio update, a dispatcher monitoring fleet operations or an operator working with alerts, all without relying on maps.
In these situations, displaying traffic flow geometries is not enough. The underlying traffic observations need to be transformed into concise, human-readable updates.
In this article, we will explore the building blocks needed to create a traffic broadcaster powered by HERE Traffic API. Rather than building a complete end-to-end application, we will look at how traffic flow data can be selected, enriched with location context and converted into broadcast-style messages for different audiences.
The idea is simple:
HERE Traffic API → Select congestion → Add location context → Generate a traffic broadcast
Using traffic flow data for San Francisco as an example, we can focus on one selected road segment with reduced traffic flow. The resulting data will then be provided to a language model through a structured prompt, producing different versions of a traffic bulletin.
Making a request to HERE Traffic API is straightforward. The following example requests current traffic flow data for road segments within a 10-kilometer radius of a point in San Francisco:
text1https://data.traffic.hereapi.com/v7/flow2?locationReferencing=shape3&in=circle:37.75982951763174,-122.48700810218043;r=100004&apiKey=YOUR_API_KEY5
By setting locationReferencing=shape, the response can include the road geometry associated with each traffic flow observation. An application can use this geometry for visualization or further spatial analysis.
Visualizing the returned geometries shows where traffic flow observations are available. However, geometry alone does not explain whether traffic is moving freely or traveling slowly. The traffic attributes returned with each flow item provide the context needed to interpret current conditions.
The orange lines in the accompanying images represent road geometries returned by HERE Traffic API. At this stage, they are not styled according to congestion severity. They simply show where traffic flow observations were returned for the requested area.


When attributes such as jamFactor, current speed, freeFlow, and traversability are incorporated into the application logic, the traffic situation becomes easier to interpret.
For example, an application can compare the current speed with the free-flow speed and use jamFactor to distinguish relatively free-flowing traffic from more heavily congested conditions.
For comparison, the same area can also be viewed in HERE WeGo.

The appearance and timing of the traffic information may differ from the example output because traffic flow conditions change over time. The screenshots and sample responses in this article represent the conditions observed when the example data was captured and may not match the results of a new API request.
Instead of exposing the underlying traffic data directly, imagine transforming it into a message such as this:
Traffic on Fremont Street in San Francisco is moving well below the reported free-flow speed. The selected road segment remains open, but drivers should expect significantly reduced speeds through this area.
This is the idea behind the traffic broadcaster. The application does not simply show congestion on a map. It makes the traffic data speak.
The overall process is to:
Request current traffic flow data for a defined geographic area
Select road segments according to application-defined congestion criteria
Inspect the returned road geometries and traffic flow attributes
Extract coordinates from selected geometries
Reverse geocode coordinates to add location context
Pass validated, structured data to a language model
Generate concise, human-readable traffic bulletins
The ranking, selection, location enrichment and bulletin generation are application-level processing steps. They are not direct outputs of HERE Traffic API.
Raw traffic flow data is valuable, but operators rarely want to inspect thousands of individual road segments. They need concise updates that highlight what matters most at a particular moment.
Depending on the case, a traffic broadcaster could support:
Fleet dispatch dashboards
Last-mile delivery monitoring
Digital twin platforms
Smart city command centers
Operations center displays and wallboards
Notification workflows
Spoken or text-based traffic updates
A traffic broadcaster can transform network-wide traffic observations into short, audience-appropriate summaries. HERE Traffic API provides the source traffic information, including flow attributes and, when requested, the associated road geometry. The application then decides which observations to select and how to describe them.
A traffic flow response can include values such as:
Speed: the current estimated traffic speed
freeFlow: the estimated speed under free-flow conditions
jamFactor: an indicator of traffic quality or congestion
Confidence: the confidence associated with the flow observation
Traversability: the reported traversability state
Road geometry: spatially described set of points
Values such as speed are returned using the units defined by the API schema. Before displaying them to end users, the application should convert or label those values explicitly.
Together, these attributes provide useful inputs for application-specific traffic analysis. An application can compare current and free-flow speeds, evaluate jamFactor and confidence, inspect traversability and process the geometry before generating a descriptive summary.
It is also important to distinguish traffic flow from traffic incidents. Reduced speed or a high jamFactor does not, by itself, explain why congestion exists. If a bulletin needs to mention a collision, roadwork, a hazard or another event, the application should query and validate HERE Traffic API incident data rather than infer an incident from flow values alone.
In the following demonstration, I use traffic flow data that was previously extracted and processed with an FME workflow described in an earlier article. That workflow parses the HERE Traffic API JSON response and writes the returned traffic attributes and geometries to a table.
The purpose of this article is not to rebuild that data-processing pipeline. Instead, we will focus on how the resulting traffic observations can be transformed into human-readable broadcasts.
FME is used here as a convenient processing and inspection tool, but it is not required to call HERE Traffic API or to implement this concept. The same building blocks could be implemented using regular API requests and application code.
The primary values used in this example are:
jamFactor
Speed
freeFlow
Confidence
Traversability
The returned road geometry
jamFactor is a numeric indicator of traffic quality. Higher values indicate progressively worse traffic flow conditions. However, the application should evaluate jamFactor separately from traversability. It should not infer that a road is closed solely because the jamFactor is high or has reached its maximum value.
Traversability reports the traversability state associated with the flow item:
Open: the roadway is open and can be driven.
Closed: the roadway is closed or blocked and cannot be driven.
reversibleNotRoutable: the roadway is reversible but is currently not routable.
The first step is deciding which traffic observations deserve attention.
In the following example, the returned flow items are sorted by jamFactor to identify candidate road segments with relatively poor traffic flow in the queried area. The goal is not necessarily to take the first row and declare it the most congested street. Before selecting a segment, the application should also inspect its confidence, traversability, current speed, free-flow speed, geometry length and neighboring flow observations.

The following excerpt contains the main fields used for the selected example (in the image I have changed the visualization color from yellow to red). Fields unrelated to this walkthrough have been omitted for readability.
JSON1{2"location": {3"length": 3934},5"currentFlow": {6"speed": 2.2222223,7"speedUncapped": 2.2222223,8"freeFlow": 9.444445,9"jamFactor": 5.1,10"confidence": 0.84,11"traversability": "open"12}13}14
This selected flow item describes a road geometry approximately 393 meters long. Its reported current speed is lower than its free-flow speed, while the traversability value indicates that the road remains open.
Before sending any of these values to a language model, the application should validate and normalize them. It may also convert the speed values into units that are more appropriate for the intended audience.
Generated text must remain grounded in the supplied fields. A language model should not infer incidents, hazards, closures, causes, delays or operational consequences that are absent from the source data.
Each selected flow item can contain road geometry. In this demonstration, the first and last coordinates are extracted from the selected geometry.

These coordinates are the endpoints of the returned geometry. They should not automatically be described as the beginning and end of the overall congestion, and they do not necessarily represent road intersections.
The extracted coordinates can be sent to HERE Geocoding & Search API using a reverse geocoding request. The resulting address information adds human-readable location context to the traffic observation.
For this example, reverse geocoding the two geometry endpoints return locations around:
199 Fremont Street, San Francisco
151 Fremont Street, San Francisco
The complete reverse geocoding responses can be included here as returned by HERE Geocoding & Search API.
Reverse-geocoded addresses should be treated as contextual labels for the selected geometry endpoints. They do not prove that congestion starts or ends at those precise addresses.
The order of the coordinates may also provide an approximate orientation for the geometry, but the application should not use that order to announce direction of travel unless the relevant API data explicitly supports that interpretation.
Now we can combine the selected traffic attributes with the reverse-geocoded location context and generate a traffic broadcast.
The language model is not being asked to discover congestion or analyze the road network independently. Those decisions happen before the prompt is created. The model receives a validated, structured representation of one selected traffic observation and transforms it into a language suitable for different audiences.
In the next example, I will use the following prompt:
text1You are an experienced traffic communications specialist responsible for converting structured traffic data into spoken reports.2
3GOAL4
5Transform the provided traffic JSON into three distinct traffic broadcasts suitable for different audiences:6
71. Radio Traffic Reporter82. Traffic Control Dispatcher93. Emergency Operations Center Report10
11CONTEXT12
13The input is a structured JSON object containing validated traffic flow information, road and location context, traffic speed, free-flow speed, jam factor, confidence, traversability and reverse-geocoded geometry endpoints.14
15SOURCE16
17Use only the information explicitly provided in the input.18
19Do not invent or infer:20
21•	Incidents22•	Collisions23•	Roadworks24•	Hazards25•	Closures26•	Causes of congestion27•	Delay durations28•	Traffic direction29•	Operational impacts30•	Recommendations unsupported by the source data31
32Mention route or direction information only when it is explicitly provided by the source data.33
34Treat the origin and destination values as contextual labels for the endpoints of the returned road geometry. Do not state that they represent the exact beginning and end of the congestion.35
36EXPECTATIONS37
38General rules:39
40•	Create reports that sound natural when read aloud41•	Convert abbreviations into spoken language where appropriate42•	Highlight the most important supported traffic impact first43•	Keep each report approximately 15 to 30 seconds when spoken44•	Mention delay duration only when it is explicitly provided45State that a road is open or closed only when supported by the traversability value.46Use professional language appropriate for each audience.47Clearly distinguish observed traffic flow from reported incidents.48Do not state that no incidents exist unless incident data was supplied and confirms this.[BL2.1]49
50OUTPUT FORMAT51
52## Radio Traffic Reporter53
54Style:55
56•	Conversational57•	Listener-friendly58•	Suitable for a live traffic update59•	Focused on the practical effect of the reported traffic flow60•	Include driving advice only when it is directly supported and appropriate61
62## Traffic Control Dispatcher63
64Style:65
66•	Concise67•	Operational68•	Focused on the supplied facts69•	Minimal narrative70•	Include confidence and traversability when provided71
72## Emergency Operations Center Report73
74Style:75
76•	Formal77•	Focused on situational awareness78•	Suitable for operational personnel79•	Include the affected area and supported traffic-flow severity80•	Do not invent an emergency or operational impact81
82INPUT JSON:83
84{{JSON_DATA}}85
86GEOMETRY START CONTEXT:87
88{{FROM_LOCATION}}89
90GEOMETRY END CONTEXT:91
92{{TO_LOCATION}}93
94Generate all three reports.95
The structured traffic object is inserted into {{JSON_DATA}}. The direct reverse geocoding responses, or the required fields extracted from them, are supplied as {{FROM_LOCATION}} and {{TO_LOCATION}}.
For the example traffic observation, the generated output could look like this for each different audience:
Radio Traffic Reporter
Traffic is moving slowly on Fremont Street in San Francisco's East Cut area, near the section between the addresses identified around 199 and 151 Fremont Street. Current speeds are about 2.2 meters per second, well below the typical free-flow speed of roughly 9.4 meters per second. The roadway remains open, but motorists should expect noticeably reduced traffic flow through this location.
Traffic Control Dispatcher
Traffic flow observation for Fremont Street, The East Cut, San Francisco.
Road segment length: 393 meters. Current speed: 2.2 meters per second. Free-flow speed: 9.4 meters per second. Jam factor: 5.1. Confidence: 0.84. Traversability: Open.
Observed traffic is moving significantly below free-flow conditions. No incident or closure information provided.
Emergency Operations Center Report
Traffic monitoring indicates reduced vehicle flow on a 393-meter road segment along Fremont Street in the East Cut district of San Francisco, in the vicinity of the roadway geometry bounded by locations near 199 and 151 Fremont Street. Current measured speed is approximately 2.2 meters per second compared with a free-flow speed of approximately 9.4 meters per second. The reported jam factor is 5.1, indicating moderate traffic congestion. Confidence in the measurement is 0.84. The segment remains traversable and is reported as open. No incident, closure or hazard information is included in the source data.
The generated paragraphs demonstrate the main purpose of the concept—the same underlying traffic observation can be communicated differently depending on the audience.
The radio version favors natural, listener-friendly language. The dispatcher version prioritizes concise operational facts. The Emergency Operations Center version provides a more formal situational summary without inventing an emergency, incident or unsupported operational impact.
The generated output should still be treated as a draft. Before publication or distribution, the application should verify that every statement can be traced back to the structured source data.
This article focuses on the processing pattern rather than prescribing complete architecture.
The processing function could run locally, in a container, on a virtual machine or on a serverless platform such as AWS Lambda or Azure Functions. The best deployment option depends on the surrounding application, infrastructure, operational requirements and expected request frequency.
A separate scheduler could invoke the processing function at a configured interval. Each execution could:
Request a new traffic flow response
Validate the freshness and structure of the response
Select candidate traffic flow observations
Add location context through reverse geocoding
Construct the structured language-model input
Generate draft traffic bulletins
Validate the generated statements
Send the approved output to the chosen channel
Possible output channels include operational dashboards, chat-based tools, notification systems, wallboards, text-to-speech services or other applications that need concise traffic updates.
A production implementation would require additional safeguards, including:
Data freshness checks
Confidence thresholds
Input validation
Unit conversion
Error handling
Authentication and secret management
Monitoring and logging
Language-model output validation
Protection against unsupported generated statements
Clear separation between traffic flow and incident information
In this article, we explored a different way of working with traffic data. Rather than displaying congestion only on a map, we transformed HERE Traffic API observations into human-readable traffic broadcasts using location enrichment and AI-assisted text generation.
We started with traffic flow data for a defined area and examined attributes such as speed, freeFlow, jamFactor, confidence and traversability. We then selected a candidate road segment, processed its returned geometry and reverse geocoded its endpoints with HERE Geocoding & Search API to add location context.
Finally, we provided the validated traffic and location data to a language model through a structured prompt. The model transformed the same observation into messages for a radio traffic reporter, a traffic control dispatcher and an Emergency Operations Center.
The important distinction is that HERE Traffic API provides the source traffic observations, while the application supplies the additional processing logic. Selecting candidate segments, processing geometries, calculating lengths, reverse geocoding coordinates, preparing prompts and generating natural-language bulletins are application-level steps.
These derived results should therefore be presented with appropriate context and validation. Reverse-geocoded endpoints should not be treated as the exact boundaries of congestion. Direction should not be inferred unless it is explicitly supported. Incidents, causes, closures and delay durations should not be generated from traffic flow values alone.
For production use, traffic flow and incident information should remain clearly separated, and every generated statement should be validated against its source data.
Most traffic examples finish by putting colored lines on a map. A traffic broadcaster takes the next step: it turns those observations into information that people can hear, read and act on.
In other words, it makes traffic data speak.

Alberts Jekabsons
Sr. Developer Evangelist
Share article
Why sign up:
Latest offers and discounts
Tailored content delivered weekly
Exclusive events
One click to unsubscribe