4 min read
21 November 2018
The Urban Mobility Index brings focus to all the possibilities of city transit
What goes into creating our interactive tool that shows an urban environment’s full complement of transit possibilities? Let’s take a closer look at the data of the city.
When you close your eyes and imagine a city, what do you see? Perhaps you see a skyline of buildings stretching across the horizon and reaching up to the clouds. Maybe you can see the lights and sounds coming from the streets. And, when you think of the streets, you can almost certainly see the traffic.
Though in our minds, cities and traffic may go hand in hand, there’s quite a bit more to keeping a city moving than the cars and trucks we see on the streets. The inventory of all the means of travel in a city is part of what we call mobility.
Most of the world’s cities contain a host of elements which are capable of moving people and goods: buses, trains, subways, cars, taxis, bicycles, e-bikes, powered scooters, delivery trucks, ferries, shared cars and more. With these alternative transport methods growing every day, it falls to a city’s leaders and their residents to learn and adopt all these varied elements collectively to raise the efficiency of movement, while easing congestion and lowering carbon emissions.
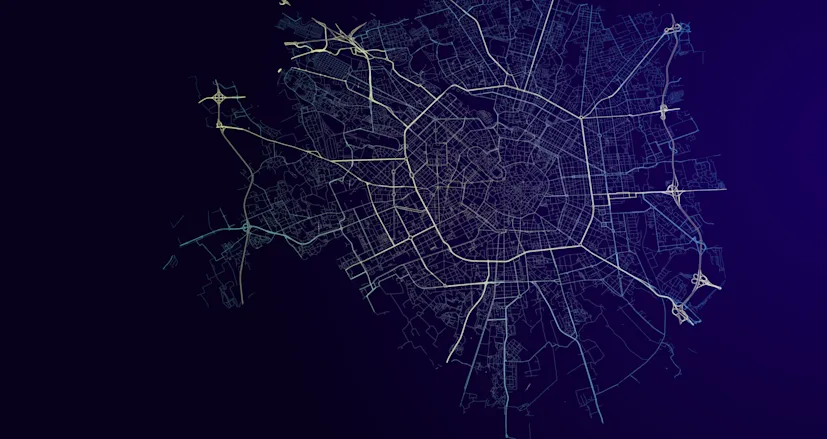
We can visualize what mobility looks like.
To create a broader, informative, context-driven view of how we move people and goods around within our densely populated urban environments, we’re excited to share our new online tool called the Urban Mobility Index.
For this first version of the Urban Mobility Index, we reached deep into our own data stores and combined that information with multiple open source data portals to assess 38 worldwide cities according to multiple indicators for mobility. Those include criteria such as the average time vehicles spend in traffic, the efficiency and cost of public transportation, the level of automation the city’s infrastructure.
We also looked at how cities are raising their mobility game while also raising their environmental game. Therefore, we also looked at the prevalence of green spaces, how cities implement low-emission zones, where electric vehicle charging points are being added, and the integration of bike sharing schemes.
In the index, look at Singapore. The 50-year-old nation state has kept traffic very low by leveraging tolls, premium costs for automobile licensing, and a pro-active approach to roadway maintenance. The revenues generated by traffic on the roadways help expand the trains and public transit systems, which can be maintained and kept affordable for residents.
Similarly, the city of Hamburg has seen great expansion in recent years. The city has focused on expanding public transit early in the newest developing areas of the city, while also prioritizing construction and maintenance work in the busiest road traffic corridors. As they city has dramatically improved the ability to move in and out of the city center, they’re now using the same data-driven observations to improve mobility within the inner-city.
These data-driven insights are easier to develop through context-driven visualizations that aid in rapidly identifying the areas of cities that need help. No longer should planners need to look at one map for street traffic, another app for transit routes, and a pile of paperwork for construction plans.
The Urban Mobility Index provides a new lens through which you can explore urban mobility across a big range of different cities. The metrics draw upon a wide range of data to show where the leading cities are in providing and improving urban mobility to their citizens and visitors.

Bradley Walker
Share article
Bradley Walker
Sign up for our newsletter
Why sign up:
Latest offers and discounts
Tailored content delivered weekly
Exclusive events
One click to unsubscribe