
APIs
#BuiltWithHERE
How NEXQT Uses HERE Traffic Analytics to Power Urban Digital Carbon Twins
Alberts Jekabsons — 22 April 2026
7 min read
12 May 2026

Cities today collect enormous amounts of transportation data: shared scooters and bikes, connected cars, traffic sensors, road safety systems. But making sense of it usually means hiring GIS specialists, commissioning studies, or waiting months for a consultancy to deliver a PDF that’s already outdated.
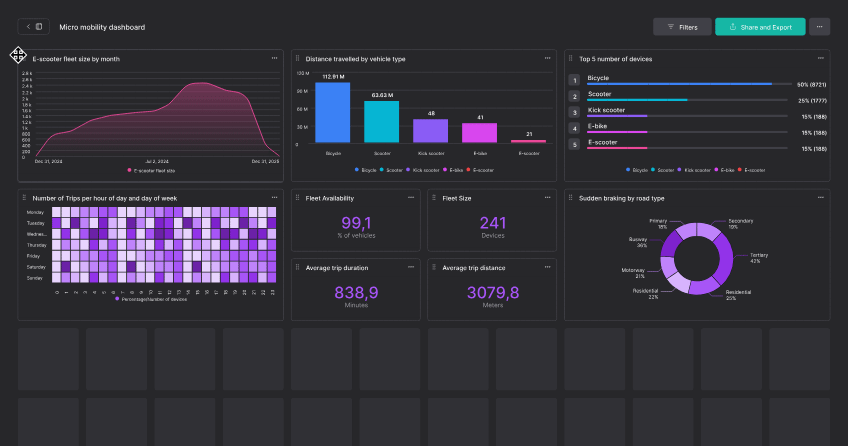
In this #BuiltWithHERE story, we look at how Vianova makes mobility data accessible to the people who actually need it, city planners, transport authorities, policy makers, not just data engineers. Their platform, VIP (Vianova Intelligence Platform), brings several different datasets together on a single interactive map where anyone can explore, question, and cross-reference, no SQL, no GIS tools, no waiting.
Vianova operates across multiple cities in Europe and beyond, working with transport authorities and mobility regulators. The platform integrates 60+ data stream types such as micromobility, connected vehicles, traffic, vessel tracking, logistics, road safety, and more. They handle over 1M API requests per month, with complex geospatial queries fast enough for a truly interactive experience.
The problem isn’t a lack of data, there’s actually too much of it, and it’s all over the place.
Traffic speeds come from one provider, micromobility trips from another, road safety incidents from a third. Each one uses a different format, a different road representation, a different coordinate system. For any of this to be useful to someone who isn’t a data engineer, you need to stitch it all together onto one coherent map, invisibly, behind the scenes.
That means you need a rock-solid road network as the backbone: stable identifiers, good geometry, broad coverage. For Vianova, that backbone is HERE.
Two HERE capabilities were critical to Vianova’s platform.
HERE Traffic Analytics provides speed data at the individual road segment level, including mean speeds, standard deviations, probe counts, confidence scores, and free-flow baselines, all with directionality (northbound vs. southbound on the same street). This allows city planners to analyze changes on a single street, not just citywide averages.
HERE’s LINK_DIR identifiers provide a reliable reference frame that can be cross-matched with a city’s own road inventory. Vianova remaps HERE segments to local street IDs, so users work with street names they already know.
Vianova’s platform is built on two core HERE datasets:
HERE Traffic Analytics:
historical speed profiles with hourly granularity, mean/min/max speeds, standard deviations, probe counts, free-flow speeds, speed limits, and confidence scores per directional road segment
HERE Road Network:
road link geometries with street names used to anchor everything spatially and cross-reference with city-owned road databases
Together, they provide a consistent spatial reference for every dataset in VIP.
At a high level, Vianova’s data flow looks like:
HERE raw traffic measurements and road geometries are delivered to Amazon S3
Data is exposed via Snowflake external tables, one for traffic data and one for road geometries
dbt joins traffic data with road geometries, computes aggregations, and produces clean, queryable records
These become “streams” in the Vianova platform (a universal abstraction for any geospatial time-series) and are served through Vianova’s API
City users interact through self-serve VIP dashboards: map layers, charts, on-the-fly aggregation
Daily batch processing ensures completeness, while road ID remapping hides HERE identifiers from end users. The platform runs on AWS with Snowflake, S3, and a Python/FastAPI backend.
The biggest change here isn’t a new algorithm, but who can work with the data.
Previously, answering questions like “How have traffic speeds on this street changed since we added a bike lane?” meant exporting data, aligning road models, running GIS workflows, and producing static outputs. That process typically involved multiple specialists and long turnaround times.
With VIP, the same questions can be answered directly on an interactive map, without handling schemas, writing queries, or managing geospatial joins.

Key capabilities that enable this:
Self-service historical analysis:
more than two years of street-level speed data, sliceable by time of day, day of week, or custom date ranges.
Multi-layer correlation:
traffic speeds viewed alongside micromobility usage, heavy braking events, and road safety incidents, all aligned to the same road network. Patterns that stay hidden in isolated datasets become obvious when seen together on a map.
Familiar road references:
HERE segment identifiers are remapped to a city’s own road inventory, so users work with street names they already know.
Replicable onboarding:
standardized HERE data formats make it possible to onboard new cities without rebuilding the pipeline.
Built-in data quality signals:
probe counts and confidence scores remain visible, making it clear when measurements are statistically robust and when data is sparse.
The result is street-level traffic analysis that remains technically rigorous and is usable directly by the people making day-to-day transport decisions.
Berlin wanted to understand how traffic patterns changed over time, especially after infrastructure changes like new bike lanes or speed reductions.
By integrating HERE Traffic Analytics across the city’s full road network and remapping segments to Berlin’s Helmholtz Strassen road database, Vianova loaded more than two years of historical speed data into VIP.

City planners can now open a dashboard, click on any street using familiar Berlin road names, and instantly see historical speed trends, free-flow comparisons, and statistical distributions. They can slice by time of day, overlay bike-share usage or braking events, and spot correlations that would have been invisible in any static report.
Vianova shows what becomes possible when traffic data isn’t treated as an export, but as a shared spatial foundation. By anchoring multiple datasets to a consistent road model with HERE Traffic Analytics, cities move beyond static reports and into street-level exploration, where questions can be asked, tested, and refined directly on the map.

Mohini Todkari
Sr. Developer Evangelist
Share article
Alberts Jekabsons — 22 April 2026
Mohini Todkari — 10 March 2026
Mohini Todkari — 18 December 2025
Why sign up:
Latest offers and discounts
Tailored content delivered weekly
Exclusive events
One click to unsubscribe

