The physics of traffic
Drivers are only too familiar with phantom traffic jams: those occasions when you slow to a complete standstill, which frustratingly appear to have no concrete cause. In fact, they do have a cause - just not an obvious one. Thanks to decades of scientific research, we now have theories that not only explain why jams happen but point to ways of preventing them.
Experiments on traffic flow date back to 1933 - just 25 years after Ford’s Model T went on sale. American traffic engineer Bruce Greenshields took a movie camera out to a section of highway to record how many cars passed along it, and how long it took them.
Greenshields’ results led him to come up with a simple, linear relationship between speed and traffic density. As the number of cars per mile goes up, the speed of the traffic decreases until a particular density when it stops altogether and a jam occurs.
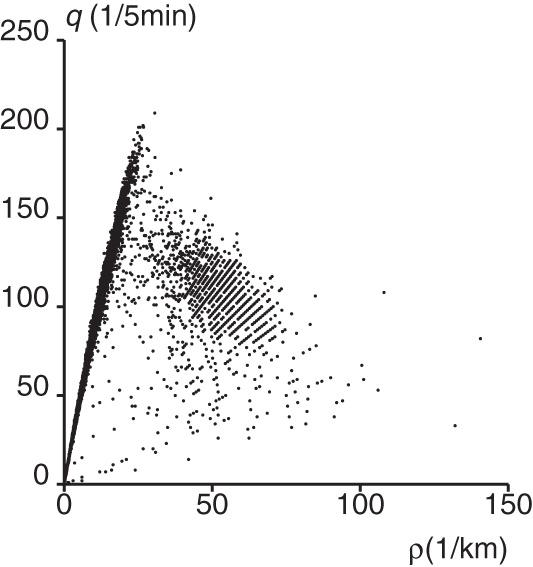
The number of cars passing along a road per hour is the ‘flow’ of traffic, and if flow is plotted against density on a graph, the curve looks like an inverted ‘V’. As the density of traffic increases, more cars per hour pass down the road and the flow rate goes up. But beyond a particular density, cars have to brake to avoid the vehicle in front. Fewer vehicles pass along per hour, so the flow rate slows, resulting in congestion.
This was important because engineers needed to know how many cars a road could carry without clogging up. Greenshields put a number on it: “With traffic not exceeding 600 vehicles per hour, the two-lane road provides ample capacity to carry the traffic except when slow-moving traffic is encountered.”
It was another 20 years before the next breakthrough in understanding traffic, and this time it came from pure theory. Theories are vital for describing known facts and predicting new phenomena. For example, Einstein’s general theory of relativity held that massive objects can bend the path of rays of light, a prediction that was only verified four years later.
For traffic, it was mathematicians James Lighthill and Gerald Whitham who came up with a theory to predict the properties of a highway. Inspired by “theories of the flow about supersonic projectiles and of flood movement in rivers”, it used the physics of kinematic waves, treating traffic like particles in a liquid.
The theory introduced the idea of shock waves in traffic. In places where cars slow up or accelerate, a traffic wave ripples back down the road. Waves, they said, were “likely to occur on any stretch of road where the traffic is denser in front and less dense behind.”
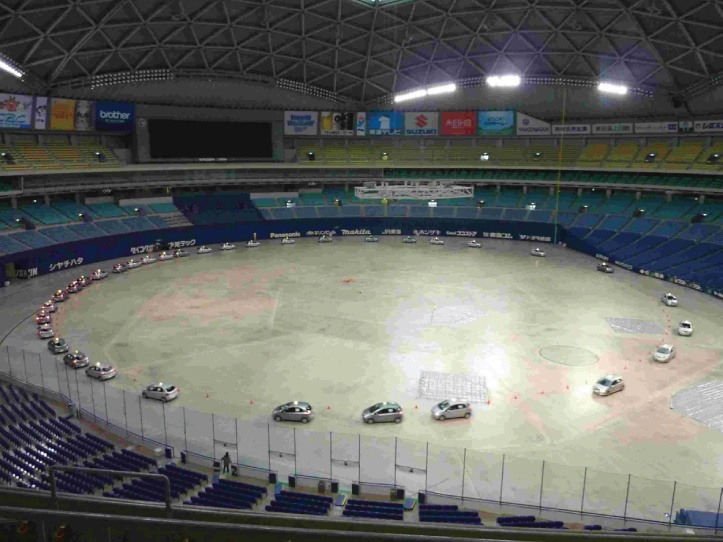
This was demonstrated in a 2008 experiment by Nagoya University’s Yuki Sugiyama and colleagues, who filmed cars travelling at 30km/h around a circular track. Before long, slight variations in speeds caused clusters to appear and a shockwave travelled backwards around the ring at 20km/h.
[youtube]https://youtu.be/Suugn-p5C1M[/youtube]
In the 1980s and 1990s, new technology enabled more accurate traffic measurements to be made on roads like the Tomei expressway in Japan. For free-flowing traffic, the graph matches Greenshields’ simple curve, but for congested flow the speed and density vary widely.
Theories to explain the experimental data began to develop around the idea that traffic behaved like a gas. Molecules in a gas travel at the same speed until they hit another molecule; cars would move until they reach a safe distance from the car in front. When flowing gas encounters a bottleneck, it creates a shockwave moving away from the blockage.
The gas theory had another consequence - phase transitions. A gas changing into a liquid is said to undergo a ‘phase change’ in its state of matter, and that’s exactly what Boris Kerner and his colleagues put into their theories in the 1990s. Kerner’s theory said there were in fact three phases of traffic: free flowing and two congested phases - synchronized flow, in which traffic in adjacent lanes moves at the same speed, and ‘wide moving jam’.
Crucially, the equations showed that more than one flow rate is possible for the same density. This phenomenon was demonstrated in Sugiyama’s 2008 experiment, and a 2013 follow-up by the same researchers demonstrated the change in phase. It showed that between low and high traffic densities is an intermediate density. In this ‘metastable’ region, flow can ‘flip’ between phases.
In other words, traffic jams needn't be caused by a broken down vehicle or an accident. Just as, under the right conditions, a speck of dust can cause water vapor to condense into liquid in a cloud, the actions of a single driver could cause a jam.
MIT traffic researcher Prof Berthold Horn explains: “Suppose that you introduce a perturbation by just braking really hard for a moment, then that will propagate upstream and increase in amplitude as it goes away from you. It’s kind of a chaotic system. It has positive feedback, and some little perturbation can get it going.”
Horn has developed an algorithm that could smooth out traffic jams, technology permitting. If cars could sense the distance to other cars both ahead and behind them, they could keep an even distance between the two. A simulation shows the algorithm taking effect after the traffic first bunches up:
However, the algorithm would only be effective if most cars on the road were kitted out with the technology. But perhaps that’s not too far off. Cars with cruise control are already equipped with laser rangefinders, and Horn’s team is working on algorithms that would allow simple digital cameras to do the same job.
Away from motorways, authorities can exert rather more control over the flow by manipulating delays at traffic signals. “What we at TRL [Transport Research Laboratory] have used a lot is a theory developed by Webster and Cobb in the mid-1960s. It looks at the flow of traffic during a ‘green period’, the distance vehicles have to travel, the amount of time they have to spend queuing (the delay), the number of lanes and the ‘saturation flow’,” explains Mark Crabtree, principal engineer at TRL.
For other kinds of junctions and road networks, statistical models and microsimulations, which look at the behaviour of individual vehicles, are used to model what’s going on. Keeping the traffic flowing, it seems, will continue to keep engineers and physicists busy.


Have your say
Sign up for our newsletter
Why sign up:
- Latest offers and discounts
- Tailored content delivered weekly
- Exclusive events
- One click to unsubscribe