Mapping Traffic Congestion
Using data collectors to analyze the impact of road projects can be expensive. As an alternative, traffic analysts can use historic HERE Traffic Analytics Street Data to conduct before and after analysis by looking at historical speeds before construction and analyzing changes and after completion. This data shows traffic behavior at a specific date and time, providing a picture of vehicle travel behaviors. With historical speed data, analysts can spot an increase or decrease in congestion during rush hour time periods or events in an area.
This article demonstrates how to get HERE Traffic Analytics data, calculate congestion, and display results on a map.
Speed Data Query
Speed data is available through a web form or an API. For this example, we will use the API to query the data because it allows us to query with coordinates instead of pre-selected administrative areas in the web form.
To access the webform or API, you need an account and a userId. To request access to HERE Speed Data, use the contact form on the HERE website.
The following Python code shows how to query the Speed Data API. To query the Speed Data API, send a JSON formatted request, and if it's successful, it will return a request id. The JSON document is included in the code for clarity. Refer to the Speed Data documentation for the query parameters.
        import os, sys, json
import requests

# JSON formatted query for speed data
query = json.loads('{"queryFilter":
                       {"location": {"geometry": "POLYGON((-118.36409 33.648269, -118.14827 33.648269, -118.14827 33.658387, -118.094146 33.658387, -118.094146 33.838692, -118.309991 33.838692, -118.309991 33.828574, -118.36409 33.828574, -118.36409 33.648269))"},
                        "isoCountryCode": "USA",
                        "locationFilter": {
                           "funcClass": {
                              "1": true,
                              "2": true,
                              "3": true,
                              "4": true,
                              "5": false
                            }
                         },
                         "startDate": "2021-10-01",
                         "endDate": "2021-10-31",
                         "requestType": "PROBE",
                         "vehicleType": "TRUCK",
                         "daysOfWeek": {
                            "U": false,
                            "M": true,
                            "T": true,
                            "W": true,
                            "R": true,
                            "F": true,
                            "S": false
                          }
                       },
                       "outputFormat": {
                          "tmcBased": false,
                          "epochType": 60,
                          "minMax": true,
                          "mean": true,
                          "stdDev": true,
                          "confidence": true,
                          "freeFlow": true,
                          "length_": true,
                          "speedLimit": true,
                          "sampleCount": true,
                          "gapFilling": false,
                          "percentiles": [85]
                       },
                       "estimatedSize": 0,
                       "userEmail": "here.developer@example.com",
                       "userId": 0000
                    }')

# setup request parameters, follow the API documentation to request an access token
access_token = 'your-token'
query_url = "https://trafficanalytics.api.here.com/dailyAnalytics/requests"
header_data = {'Authorization': 'Bearer ' + access_token}

# send request to traffic analytics API
def send_request(query):
   r = requests.post(query_url, json=body, headers=header_data)
   response = r.json()
   request_id = response['requestId']
   return request_id

# send query and get download link for data
request_id = send_request(query)
print('Request id: %s", request_id)
When the request is complete, the API will send an email with a download link to the data. We can also query the status of the request with a GET request by supplying the user id and request id:
$ curl https://trafficanalytics.api.here.com/dailyAnalytics/users/<user id>/requests/<request_id>
The query status is returned as a JSON document. When the API fulfills the request, we can use the JSON document to download the data as a CSV file. The following example demonstrates how to query the status of a request and download the data.
        # set up status request
request_id = "12345"
user_id = "0000"
status_url = "https://trafficanalytics.api.here.com/dailyAnalytics/users/"+user_id+"/"+request_id+"/"
base_dir = "./data/"

access_token = ""
headers = CaseInsensitiveDict()
headers["Accept"] = "*/*"
headers["Authorization"] = "Bearer " + access_token
headers["Accept-Encoding"] = "gzip, deflate, br"
headers["Connection"] = "keep-alive"

# download the speed data

def download_file(url):
    file_url = url.split('?')[0]
    local_filename = base_dir+file_url.split('/')[-1]
    with requests.get(url, stream=True) as r:
       r.raise_for_status()
       with open(local_filename, 'wb') as f:
          for chunk in r.iter_content(chunk_size=8192):
             f.write(chunk)
    return local_filename

# get download URL from status document
def get_download_url(id):
    request_id = str(id)
    response = requests.get(base_url+request_id, headers=headers)
    doc = response.json()
    download_url = doc["outputUrl"]
    return download_url

# get speed data
download_url= get_download_url(status_url)
download = download_file(download_url )
Calculating congestion scores
The Speed Data API provides Current Speed (speed from a probe) and Mean (the mean Free Flow Speed) along a road segment. We can calculate a congestion score with the speed data. The congestion score represents the additional travel time as a percentage. For example, if the mean travel time for a section of road is 10 minutes, then the travel time for that road with a congestion score of 50% would take 10 minutes plus 5 minutes for a total of 15 minutes of travel time. In general, a (congestion score * 100) > 30% is considered congestion.
congestion = 1 - (CurrentSpeed/FreeFlowSpeed)
Note that any scores less than 0 should be floored to 0, i.e., Current Speed is faster than Free Flow Speed.
We can also calculate a `congestion/km` metric, which measures the amount of congestion per kilometer:
∑〖SegmentLength ∗(1 -CurrentSpeed/FreeFlowSpeed)〗
Speed data is not modeled, i.e., it is raw data. and you should take into consideration the following factors when calculating a congestion score:
- Drop observations (Count) < 10 because it is a small sample size
- Time of day - more traffic during the day than at night
- Day of week - weekends have less traffic
The following code example uses the Python pandas package.
        import pandas as pd

# calculate congestion score
congestion_df = pd.read_csv(congestion_scores)
congestion_df['CONGESTION'] = 1-(df['MEAN']/df['FREEFLOW'])
congestion_df['CONGESTION-WEIGHTED'] = df['LENGTH'] * (1-(df['MEAN']/df['FREEFLOW']))

# set negative values to 0
congestion_df.loc[congestion_df['CONGESTION'] < 0, 'CONGESTION'] = 0
congestion_df.loc[congestion_df['CONGESTION-WEIGHTED'] < 0, 'CONGESTION-WEIGHTED'] = 0

# sort by date (optional)
congestion_df= congestion_df.sort_values(["DATE-TIME","EPOCH-60MIN"], ascending=True)
Preparing road map data
For this example, we use the HERE NavStreets data with the Python geopandas package to work with the spatial data. The speed data has a LINK-DIR field composed of the LINK_ID (primary key for the road segment) and the DIR_TRAVEL (direction of travel). Joining the congestion data to the street map data requires adding a LINK-DIR field to the NavStreets data.
We do this for road segments with a `T` (to) and `F` (from) direction of travel. For road segments with a `B` (includes both a to and from direction of travel), we create a dataframe of the road segments with a `B` value, then assign a `T` and `F` value to these segments, and join this dataframe to the original dataframe.
        import geopandas as gpd

# read street shapefile to a geopandas dataframe
roads = gpd.read_file('los_angeles.shp')

# add fields to NavStreets to join traffic data
roads.loc[roads['DIR_TRAVEL'] == 'F', 'LINK_DIR' ] = roads['LINK_ID'].apply(str) + roads['DIR_TRAVEL']
roads.loc[roads['DIR_TRAVEL'] == 'T', 'LINK_DIR' ] = roads['LINK_ID'].apply(str) + roads['DIR_TRAVEL']

# select roads where DIR_TRAVEL = B into a dataframe
roads.loc[data['DIR_TRAVEL'] == 'B', 'LINK_DIR' ] = ''
roads_b = data.copy()

# set DIR_TRAVEL to F in original dataframe
roads.loc[roads['DIR_TRAVEL'] == 'B', 'LINK_DIR' ] = roads['LINK_ID'].apply(str) + 'F'

# set DIR_TRAVEL to T in dataframe
roads_b = roads_b[roads_b['DIR_TRAVEL'] == 'B']
roads_b['LINK_DIR'] = roads_b['LINK_ID'].apply(str) + 'T'

# merge the dataframes
roads_ta = roads.append(roads_b)
Join congestion score to roads
The speed data is comprised of data collected by the hour. In this example, we summarize the weighted congestion score for the month. We combine the congestion scores (congestion_df) with the summarized data to the roads (roads_ta) dataframe. The mapped congestion scores are saved to a file and used with a GIS or other mapping software.
        # summarize data by road segment
congestion_summary = congestion_df.groupby('LINK-DIR')['CONGESTION-WEIGHTED'].mean().reset_index()

# create a common field name between congestion_df (LINK-DIR) and roads (LINK_DIR)
roads_ta["LINK-DIR"] = roads_ta["LINK_DIR"]

# merge congestion scores to streets
congestion_geo = roads_ta.merge(congestion_summary, on='LINK-DIR')

# remove duplicates
congestion_geo = congestion_geo.drop_duplicates()

# write to file
congestion_geo.to_file("los_angeles_congestion.shp")
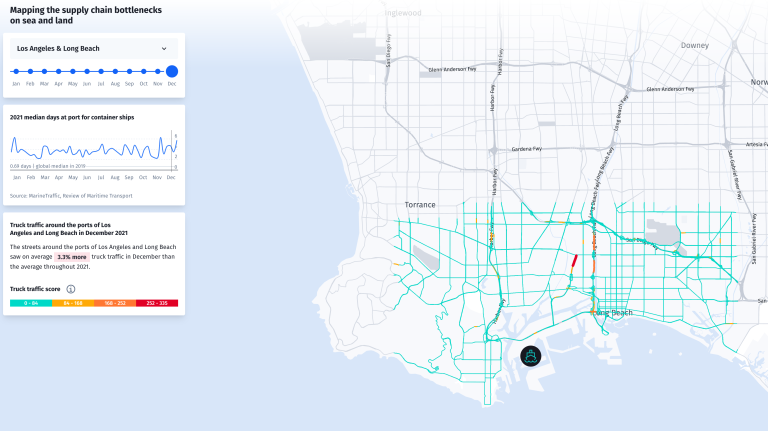
Mapping congestion
You can visualize the congestion on a map. The final product is a map of road congestion in Los Angeles.

Summary
HERE Traffic Analytics Speed Data provides historical data for evaluating the traffic patterns, and it is helpful for before-and-after analysis of road project impacts. While this example uses Python to analyze and map the data, analysts can use the data with many different tools to achieve the same analyses. Contact a HERE representative to get started with HERE Traffic Analytics.

Have your say
Sign up for our newsletter
Why sign up:
- Latest offers and discounts
- Tailored content delivered weekly
- Exclusive events
- One click to unsubscribe