How we integrated HERE Speed Data and Map Content with ArcGIS to create a traffic comparison map
Last month on HERE360 we collaborated on a blog post discussing how a €9 train ticket scheme affected the road traffic in Germany. In this developer blog post, we will describe how we prepared and processed the HERE data and integrated with ArcGIS to build the map visualization for that post. This mapping application effectively compares the historical traffic speeds for an area in Northern Germany.
Preparing Data Using GIS
For working with the data, we started in ArcGIS Pro to visualize, edit, and export a subset of HERE’s street data from our core Map Content to prepare it for later processing. Starting with a bounding box, we delineated an area in Northern Germany to serve as our area of interest (AOI) or buffer, to be used for our Traffic Analytics query which we discuss in a moment:
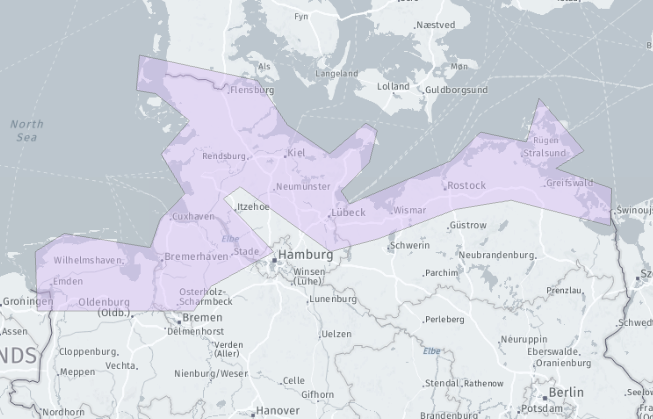
This shape was chosen based on our colleagues in Germany’s firsthand experience in the region, but specifically due to the coastal destinations as it applied to the hypothesis laid out in that blog concerning a recent transportation subsidy levied by the government there.
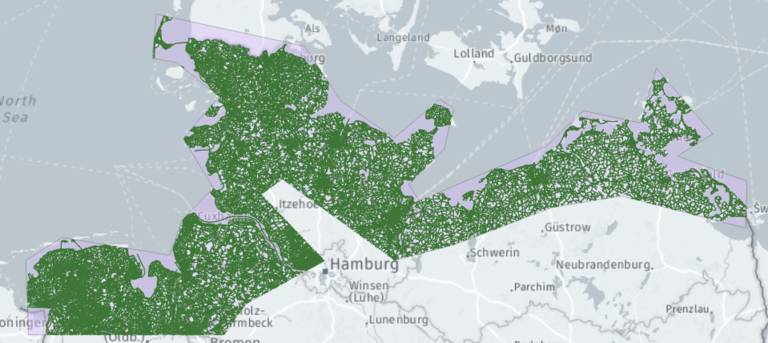
The next step in the process involved reviewing the HERE Map content street dataset to see which segments fell within our area of interest, and further, to determine which road functional classes we would want to show. This street data is vector based: polylines in shapefile format.
The HERE Map Content categorizes road segments by functional classes 1 through 5, with class 1 representing the largest highways, while class 5 would be the smallest roads, like neighborhoods. We decided to model all roads, so all functional classes were selected that fell within our bounding box which yielded 525,315 total road segments in our AOI:
From here we exported this to GeoJSON for final processing and combining with HERE Traffic Analytics Speed Data described in the next section.
Processing HERE Street Data and Combining with Speed Data
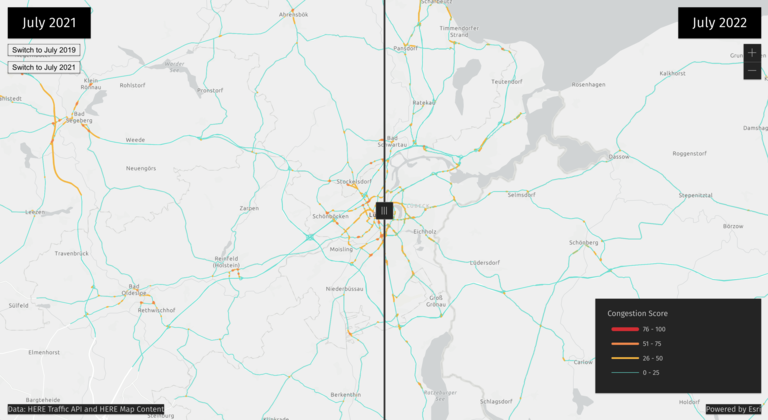
We used the HERE Traffic Analytics Speed Data to conduct a before and after analysis by looking at historical speeds in the month of July 2019, 2021, and 2022 respectively. We chose to look at daily traffic from 8 am to 6 pm at the top of the hour. To understand traffic changes, we processed this data to calculate a congestion score for each road segment and used the HERE Map Content data (street vector data) with the Python GeoPandas package to work with the spatial data. From here, we summarized the hourly congestion data for the months of July within those 3 years. For a detailed step-by-step including the scripts we used to process this data and congestion scores, look at this blog post.
        import pandas as pd
...


df['CONGESTION'] = 1-(df['MEAN']/df['FREEFLOW'])
df['CONGESTION-WEIGHTED'] = df['LENGTH'] * (1-(df['MEAN']/df['FREEFLOW']))
...
The above code snippet shows how the congestion score and weighted congestion score are calculated from the average traffic speed (‘MEAN’), freeflow traffic speed (‘FREEFLOW’), and the length of the road segments (‘LENGTH’).
The mapped congestion scores can then be saved as a GeoJSON layer file and be used with any GIS or mapping software. For this visualization, we published it as an ArcGIS Vector Tile Layer using ArcGIS Pro. A few sample features showing mapped congestion scores for road segments are shown below.
        {
"type": "FeatureCollection",
"features": [
{ "type": "Feature", "properties": { "LINK_ID": 1075875730, "ST_NAME": "B76", "FUNC_CLASS": "2", "DIR_TRAVEL": "B", "Shape_Leng": 0.00090620106847400005, "LINK_DIR": "1075875730F", "LINK-DIR": "1075875730F", "CONGESTION": 0.2028790322580645 }, "geometry": { "type": "LineString", "coordinates": [ [ 9.94190000058461, 54.432619999913129, 0.0 ], [ 9.941060000518632, 54.432960000303808, 0.0 ] ] } },
{ "type": "Feature", "properties": { "LINK_ID": 778315013, "ST_NAME": "SCHÖNBERGER STRASSE", "FUNC_CLASS": "3", "DIR_TRAVEL": "B", "Shape_Leng": 0.000539351640307, "LINK_DIR": "778315013F", "LINK-DIR": "778315013F", "CONGESTION": 0.44038530465949816 }, "geometry": { "type": "LineString", "coordinates": [ [ 10.186390000498193, 54.32611999983817, 0.0 ], [ 10.186920000657551, 54.326219999953082, 0.0 ] ] } },
{ "type": "Feature", "properties": { "LINK_ID": 554731897, "ST_NAME": "EUTINER STRASSE", "FUNC_CLASS": "2", "DIR_TRAVEL": "B", "Shape_Leng": 0.00071028200099700002, "LINK_DIR": "554731897F", "LINK-DIR": "554731897F", "CONGESTION": 0.029529569892473108 }, "geometry": { "type": "LineString", "coordinates": [ [ 10.718350000252372, 53.963739999801192, 0.0 ], [ 10.7183300002294, 53.964450000167403, 0.0 ] ] } },
{ "type": "Feature", "properties": { "LINK_ID": 758649297, "ST_NAME": "SEESTRASSE", "FUNC_CLASS": "3", "DIR_TRAVEL": "B", "Shape_Leng": 0.00046389707328899998, "LINK_DIR": "758649297F", "LINK-DIR": "758649297F", "CONGESTION": 0.009172043010752683 }, "geometry": { "type": "LineString", "coordinates": [ [ 10.772020000322811, 53.972519999998042, 0.0 ], [ 10.772080000391782, 53.972980000526661, 0.0 ] ] } },
....
]
}
User Experience and UI
Since the mapped congestion scores are published as a hosted ArcGIS Vector Tile Layer, we decided to consume our data using ArcGIS API for Javascript. We used the Swipe widget to visualize the comparison between two years: July 2022 versus July 2021 and July 2019. We added buttons to switch the leading layer between July 2021 and July 2019 and used the Legend widget to visualize the layers traffic congestion score.
Data and Products used
The HERE Traffic Analytics Speed Data and HERE Map Content data (street vector data) were used to show the historical congestion in our area of interest. ArcGIS Pro was used to work with a subset of the data and publish as a service. The ArcGIS API for JavaScript was used for the final visualization. GeoPandas Python package was used to process and work with the spatial data.

Have your say
Related articles


Sign up for our newsletter
Why sign up:
- Latest offers and discounts
- Tailored content delivered weekly
- Exclusive events
- One click to unsubscribe