How we built a map showing the distribution of EV charging stations
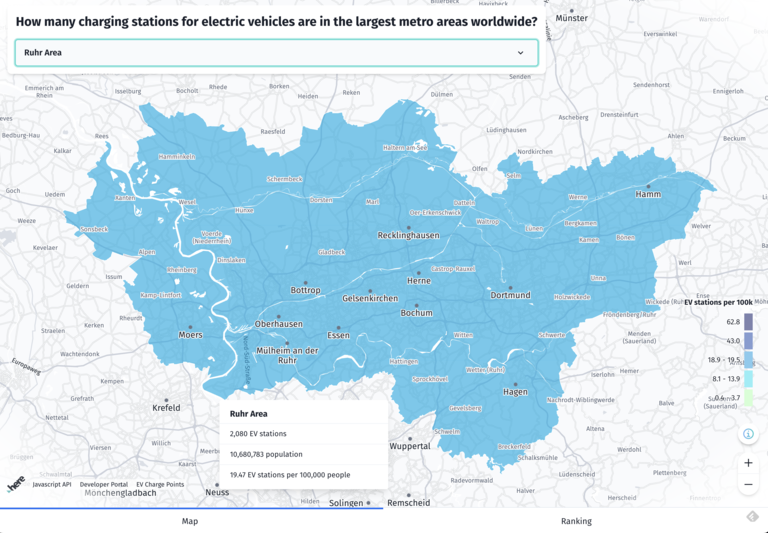
In celebration of World EV Day, HERE Technologies analyzes the distribution of EV charging infrastructure across 15 largest metro areas worldwide. The map of the analysis shows the number of EV charging stations per capita (100,000 population).
Data
This map visualization is based on the EV charging stations data available from HERE Charge Points API and population data from US Census Bureau and World Population Data. HERE Charge Points API provides lists of charging stations within a specific area, including data on connector types, operating hours, and their locations. For this visualization, we aggregate the number of charging stations and population data within the geographic border of each metro area.
User experience and UI
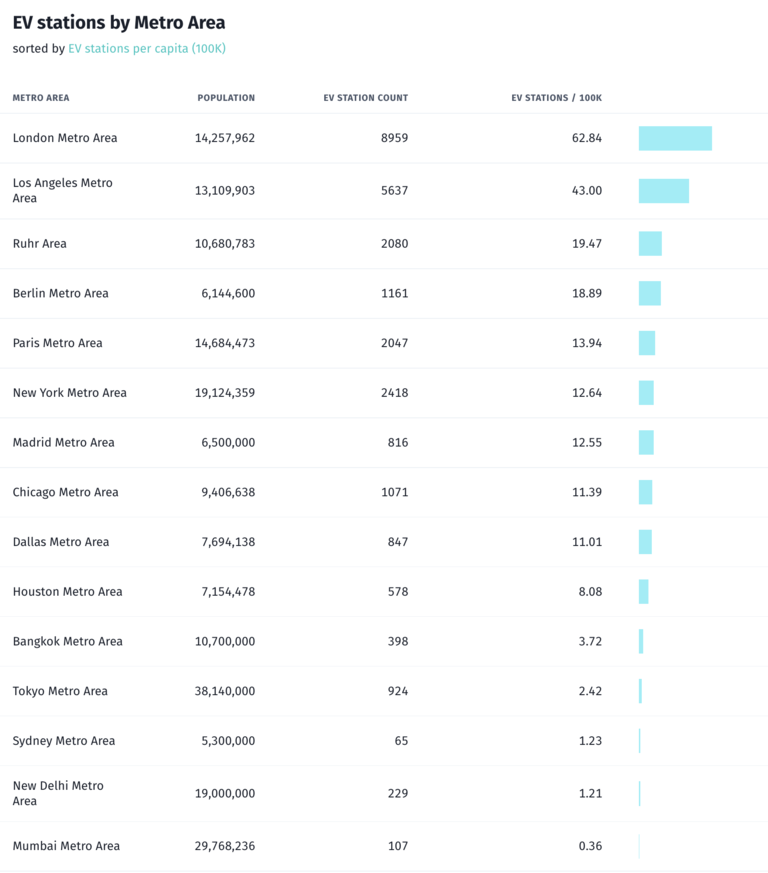
Choose from the 15 featured metro areas to see how EV charging stations are distributed among the largest metro area worldwide. In addition, you can switch to see the list of the 15 metro areas sorted by EV stations per capita. You can also hover on the metro area to see the details on the number of EV stations, population, and EV stations per 100,000 people.
Embedding the map
The map can be embedded as an iframe, with detailed instructions for desktop and/or mobile devices available under the About modal.
HERE data and products used
We used the data from HERE EV Charge Points API and the HERE Maps API for Javascript with custom grayscale styles to render the basemap

Have your say
Related articles


Sign up for our newsletter
Why sign up:
- Latest offers and discounts
- Tailored content delivered weekly
- Exclusive events
- One click to unsubscribe