Before and after COVID-19: Europe's traffic congestion mapped

With countries all across Europe in lockdown, traffic in many cities has virtually disappeared, as these maps demonstrate.
From Berlin to Bordeaux, Munich to Madrid, millions of people are staying at home as part of lockdown measures to curb the spread of coronavirus. And as a result, traffic levels across European cities have tumbled.
To show the extent of this, we've created maps comparing traffic volumes in major cities a year ago and now.
The figures are based on peak time travel at 8am on April 8th, 2019 and the same time and roads on April 6th, 2020. The data is a combination of real-time and historical and the maps are color-coded to show traffic volumes: red routes have heavy congestion, yellow moderate and green is clear.
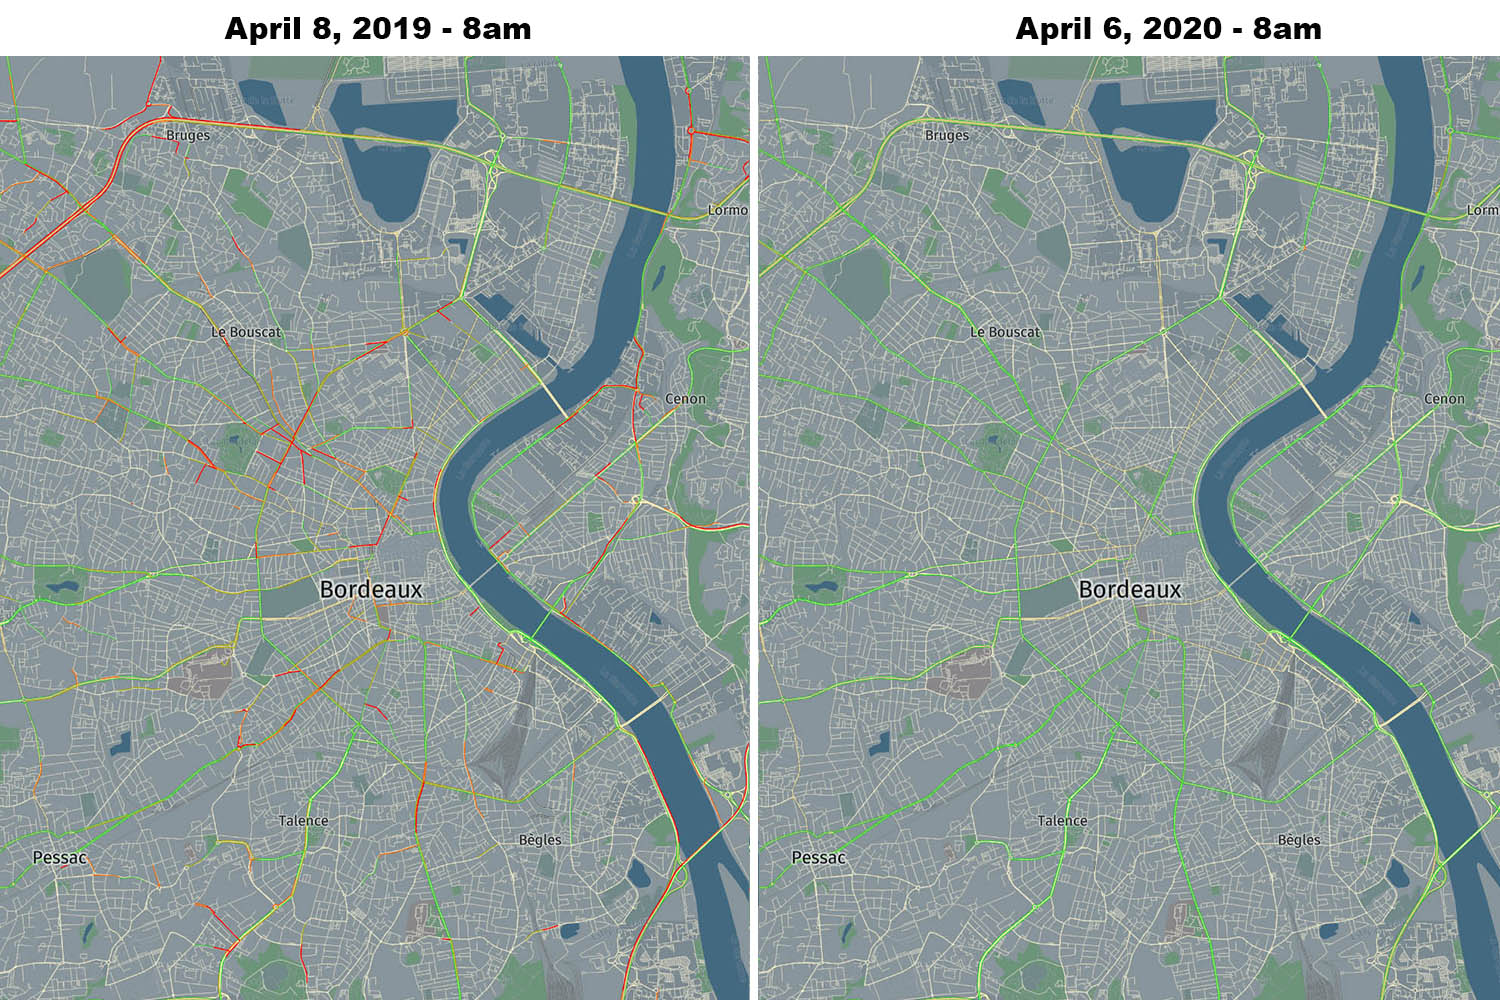
Bordeaux – 96.9% reduction in traffic
Bordeaux is a popular tourism and industrial hub in the mid-west of France but since lockdown measures, traffic congestion rates in the city have dropped from 32.3% to 1% and average speeds have increased by nearly 8km/h.
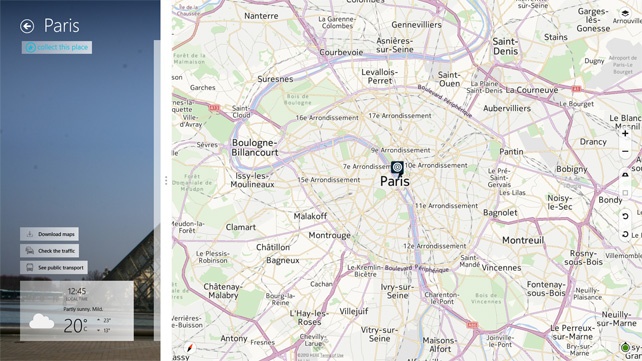
Paris – 96.8% reduction in traffic
Driving around Paris is notoriously frustrating. Motorists in the French capital spend on average 65 hours a year stuck in traffic. This time last year, 22% of its roads had congestion but since the coronavirus lockdown, this has dropped to 0.7%. As a result, the City of Light has seen average speeds rise by 16.7%.
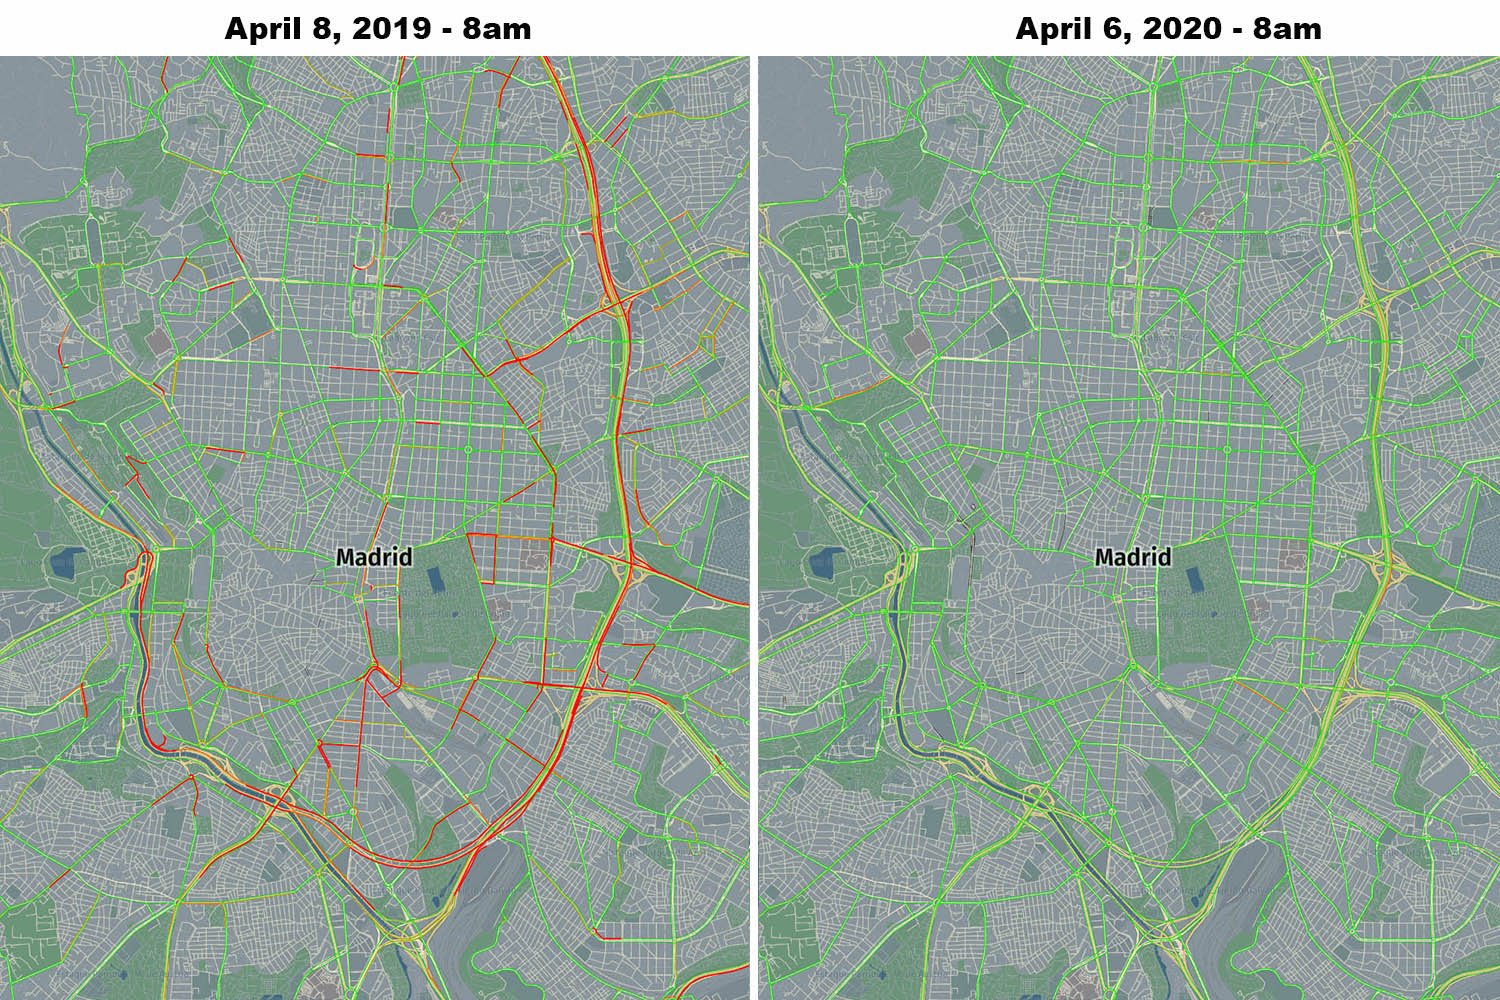
Madrid – 96% reduction in traffic
Spain has been one of the countries hardest hit by coronavirus and stringent lockdown measures have seen traffic volumes plummet on the Spanish capital's roads. A year ago, 12.8% of its streets reported congestion. That has since fallen to only 0.5%.
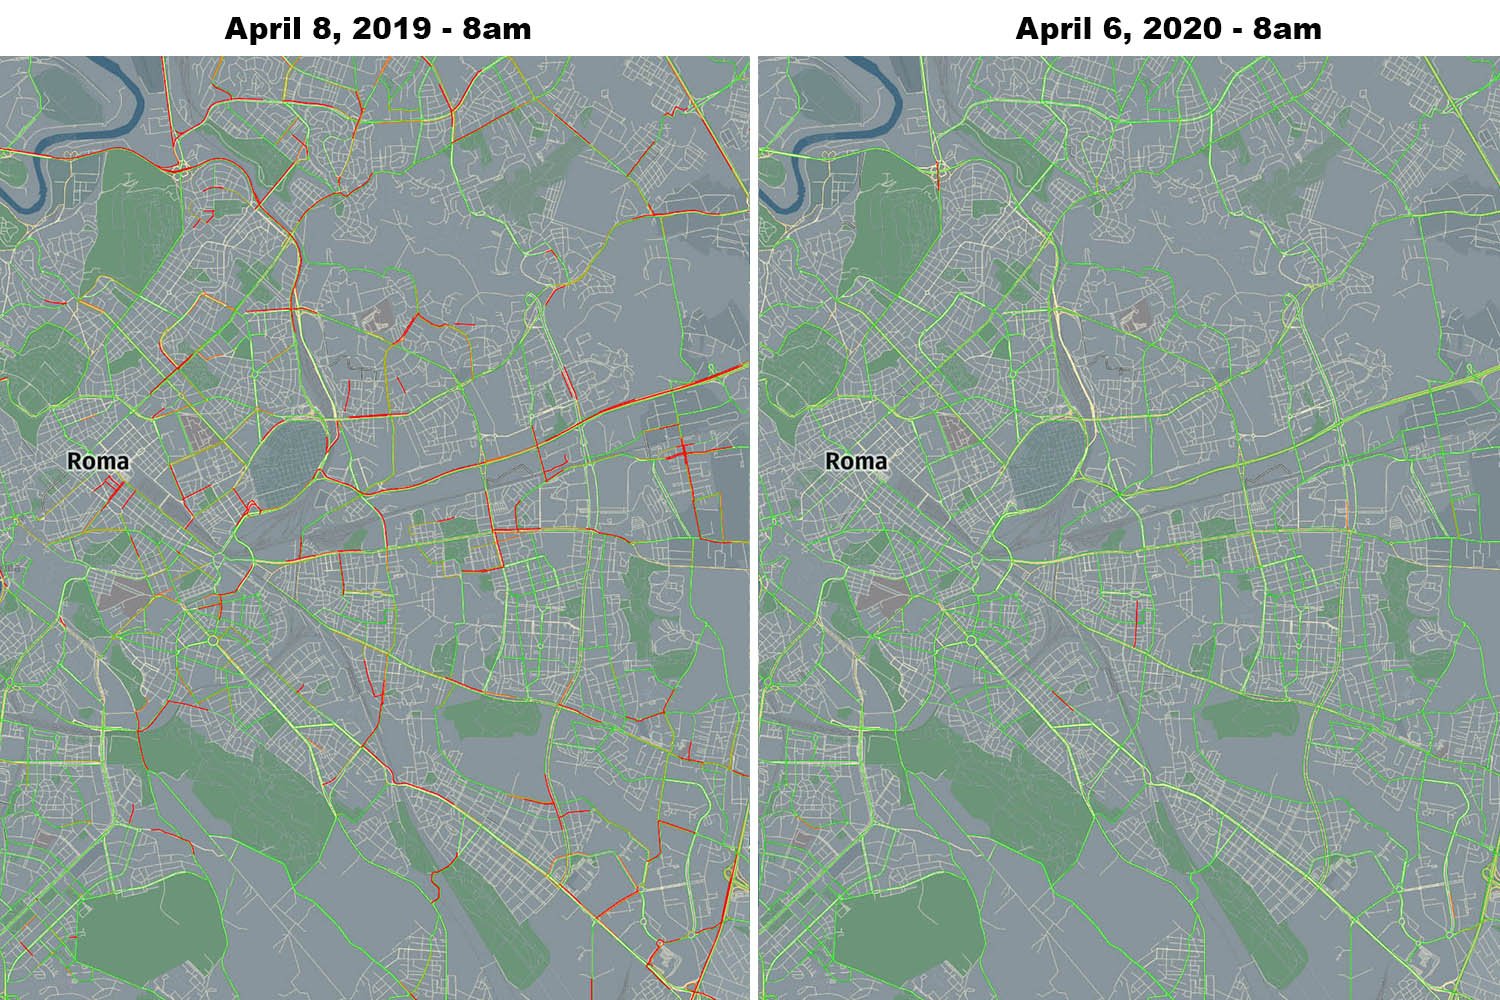
Rome – 96% reduction in traffic
The Italian city of Rome is famed for its bumper-to-bumper traffic congestion and high number of car drivers. But Rome's bustling streets have fallen silent: last year 20.1% of its major roads were congested compared to only 0.8% today. Average speeds have risen by almost 6km/h, too.
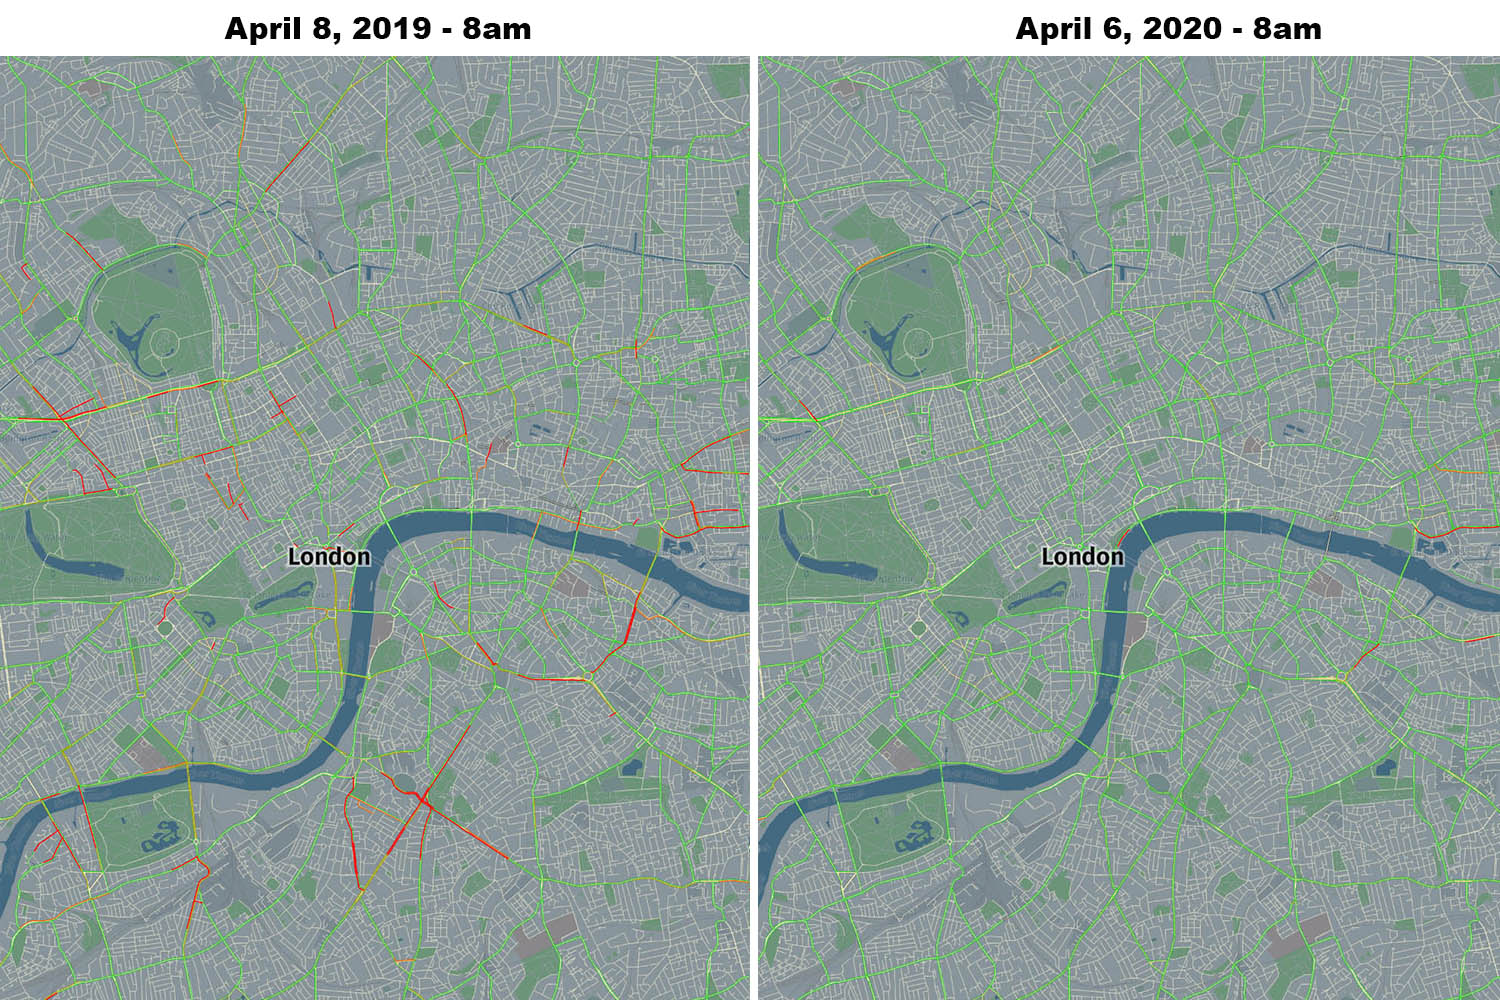
London – 90.2% reduction in traffic
London is the second most congested city in Europe and its streets are often gridlocked during peak time travel. A year ago, 9.2% of the capital's streets were marked yellow or red, but fast forward to now and only 0.9% of the roads have congestion. Consequently, the average speed has risen by 4km/h.
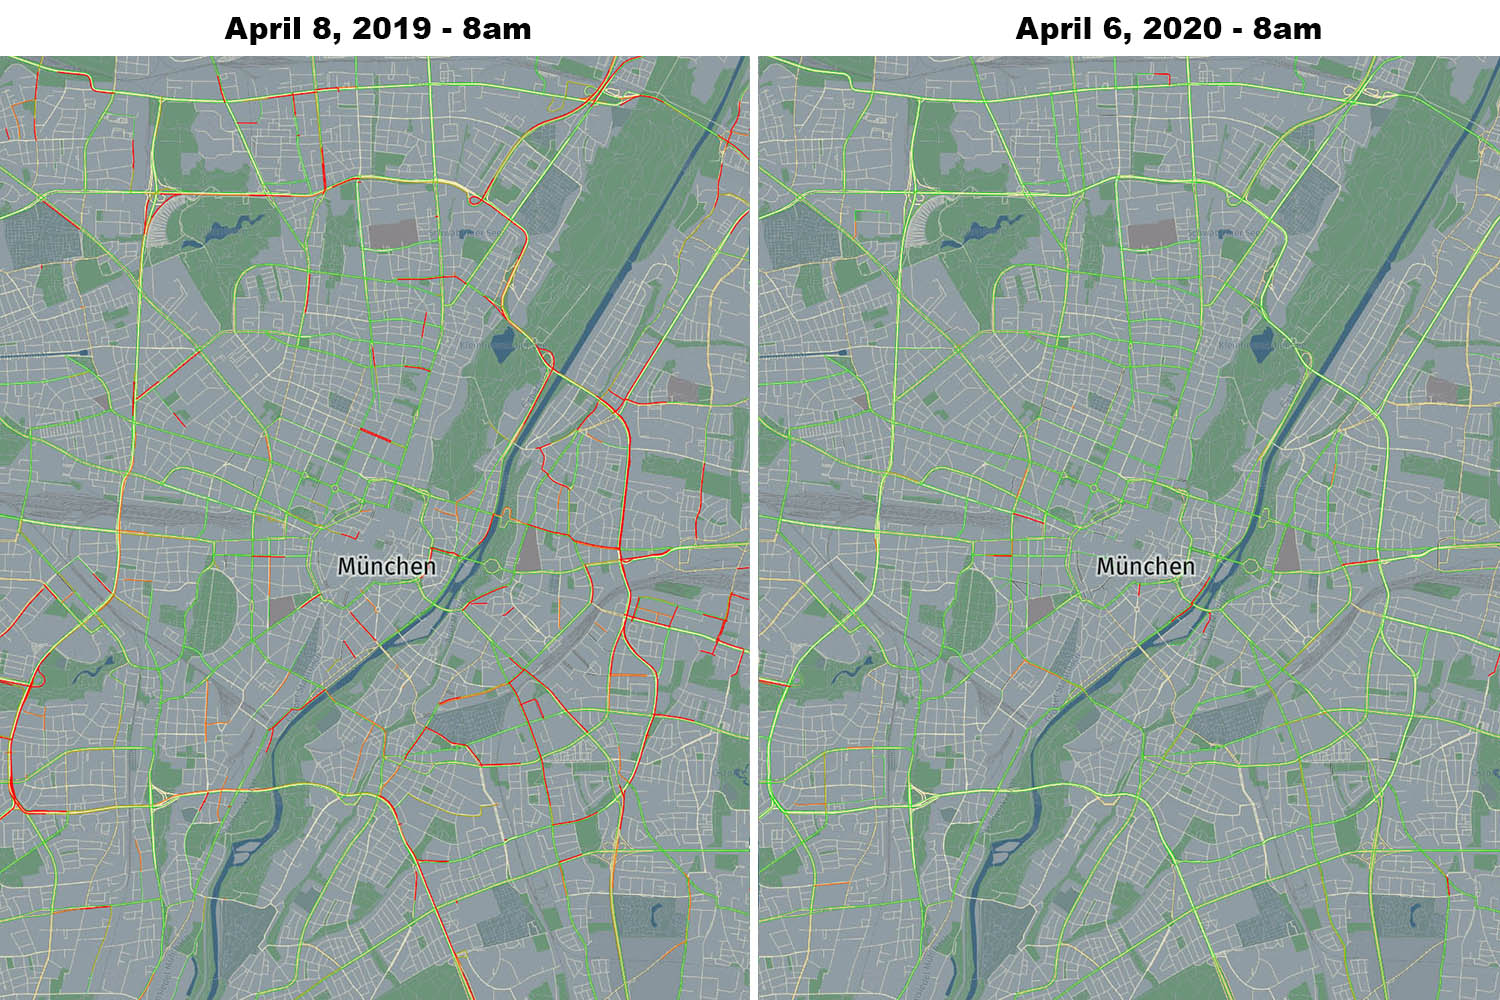
Munich – 88.6% reduction in traffic
The third largest city in Germany, Munich is an industrial powerhouse. Unsurprisingly, it's also one of the country's worst cities for traffic congestion. A year ago, 17.5% of its streets were congested at rush hour. Now, that number has fallen to 2%.
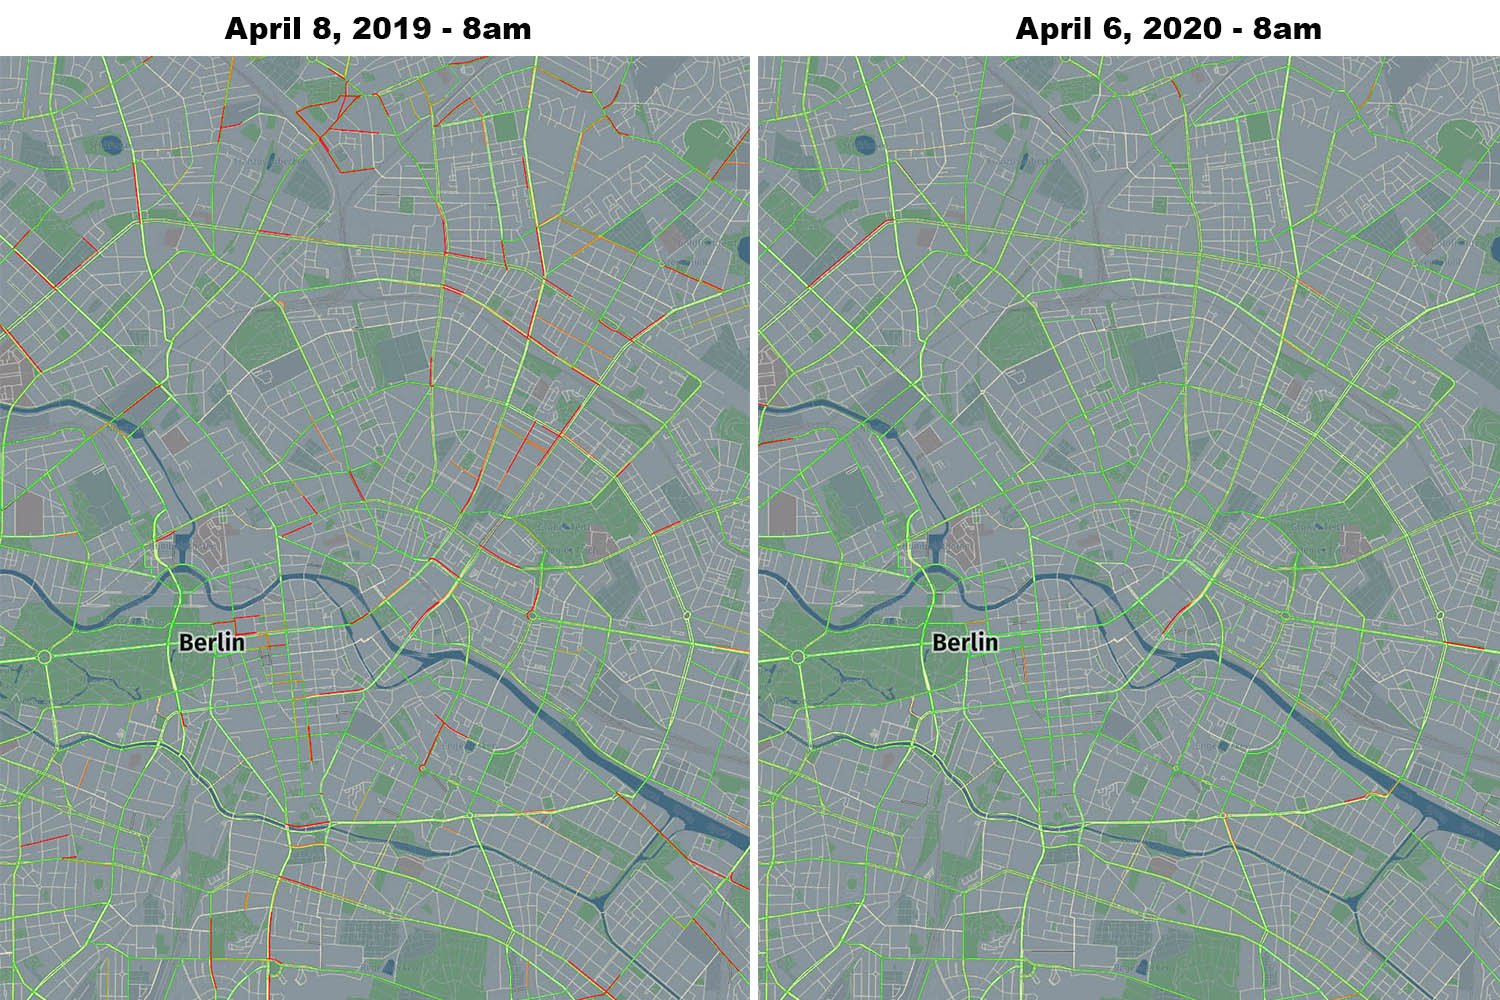
Berlin – 72.2% reduction in traffic
The German capital is not without its traffic issues and, despite a thriving cycling and public transport network, drivers waste a lot of time sitting in congestion. But like so many other cities across Europe, the COVID-19 crisis has seen roads with typically heavy and moderate traffic volume drop from 12.6% to 3.5%.
The issue for city officials is, what steps can they take to prevent the roads going back to pre-pandemic levels of congestion? At HERE, we've developed a number of tools that can help mitigate traffic and provide robust insights for planners to better plan road infrastructure and help to reduce pollution levels.

Have your say
Related articles


Sign up for our newsletter
Why sign up:
- Latest offers and discounts
- Tailored content delivered weekly
- Exclusive events
- One click to unsubscribe