Why this map of California wildfires is the map of the future
A live map of wildfires in California combining various datasets is helping with evacuation efforts. It represents the living, real-time map of the future.
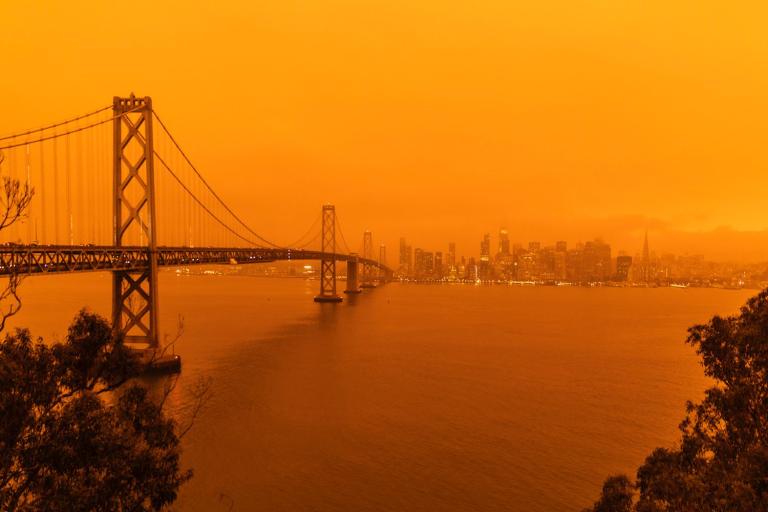
The wildfires across California, Oregon, Washington and other western states have killed dozens, destroyed thousands of buildings and left a thick layer of smoke across the West Coast and beyond.
Thousands of firefighters have been called to respond, according to the National Interagency Fire Center. This season, the wildfires have burned four million acres in California alone, an area larger than Connecticut . The smoke has even reached northern Europe.
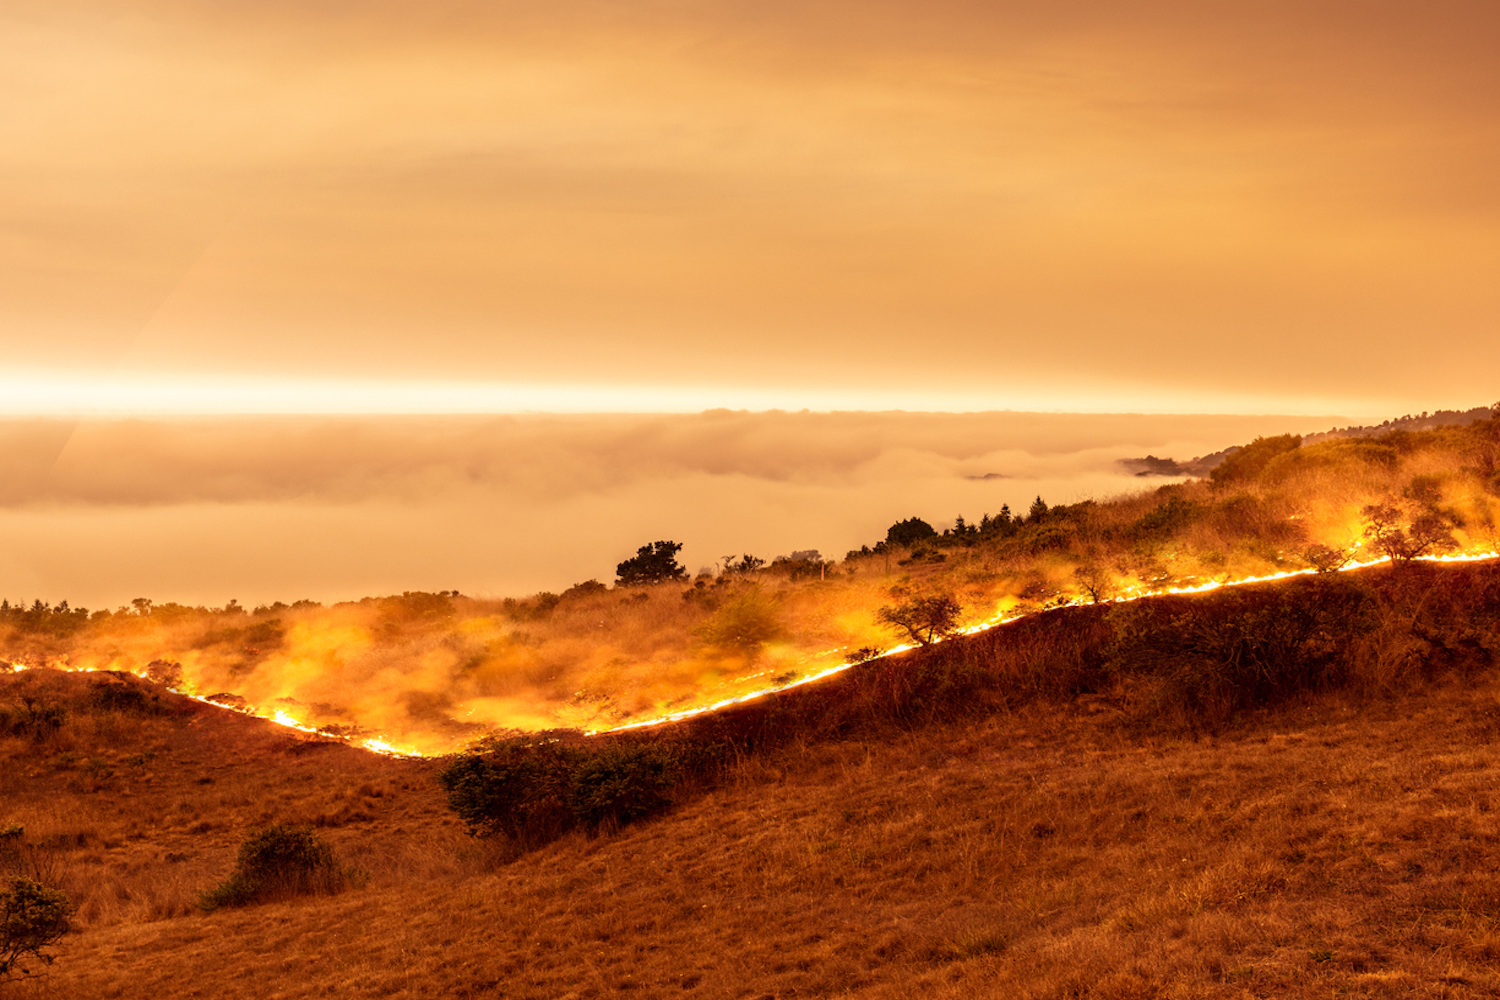
Wildfires in California have left devastation in their wake.
Firefighters and other agencies have been aided by the use of live maps in planning where to put resources and how best to respond. This one hosted by the California Fire Department showing the fires in California state has been open to the public.
“You're talking about a map that is changing – in some cases – literally minute by minute." – Alexander Osaki, Marketing Manager, HERE Technologies
The map was produced by Esri, the world leader in spatial analytics, using HERE location data. Esri and HERE have been collaborating for more than a decade, with HERE technology integrated into some of the most widely used Esri products, including ArcGIS Online, ArcGIS World Geocoder, ArcGIS Business Analyst and ArcGIS StreetMap Premium. Live maps of this kind, consisting of datasets from various sources combined, are typical of those used by emergency response agencies and other public bodies to keep up with rapidly changing situations.
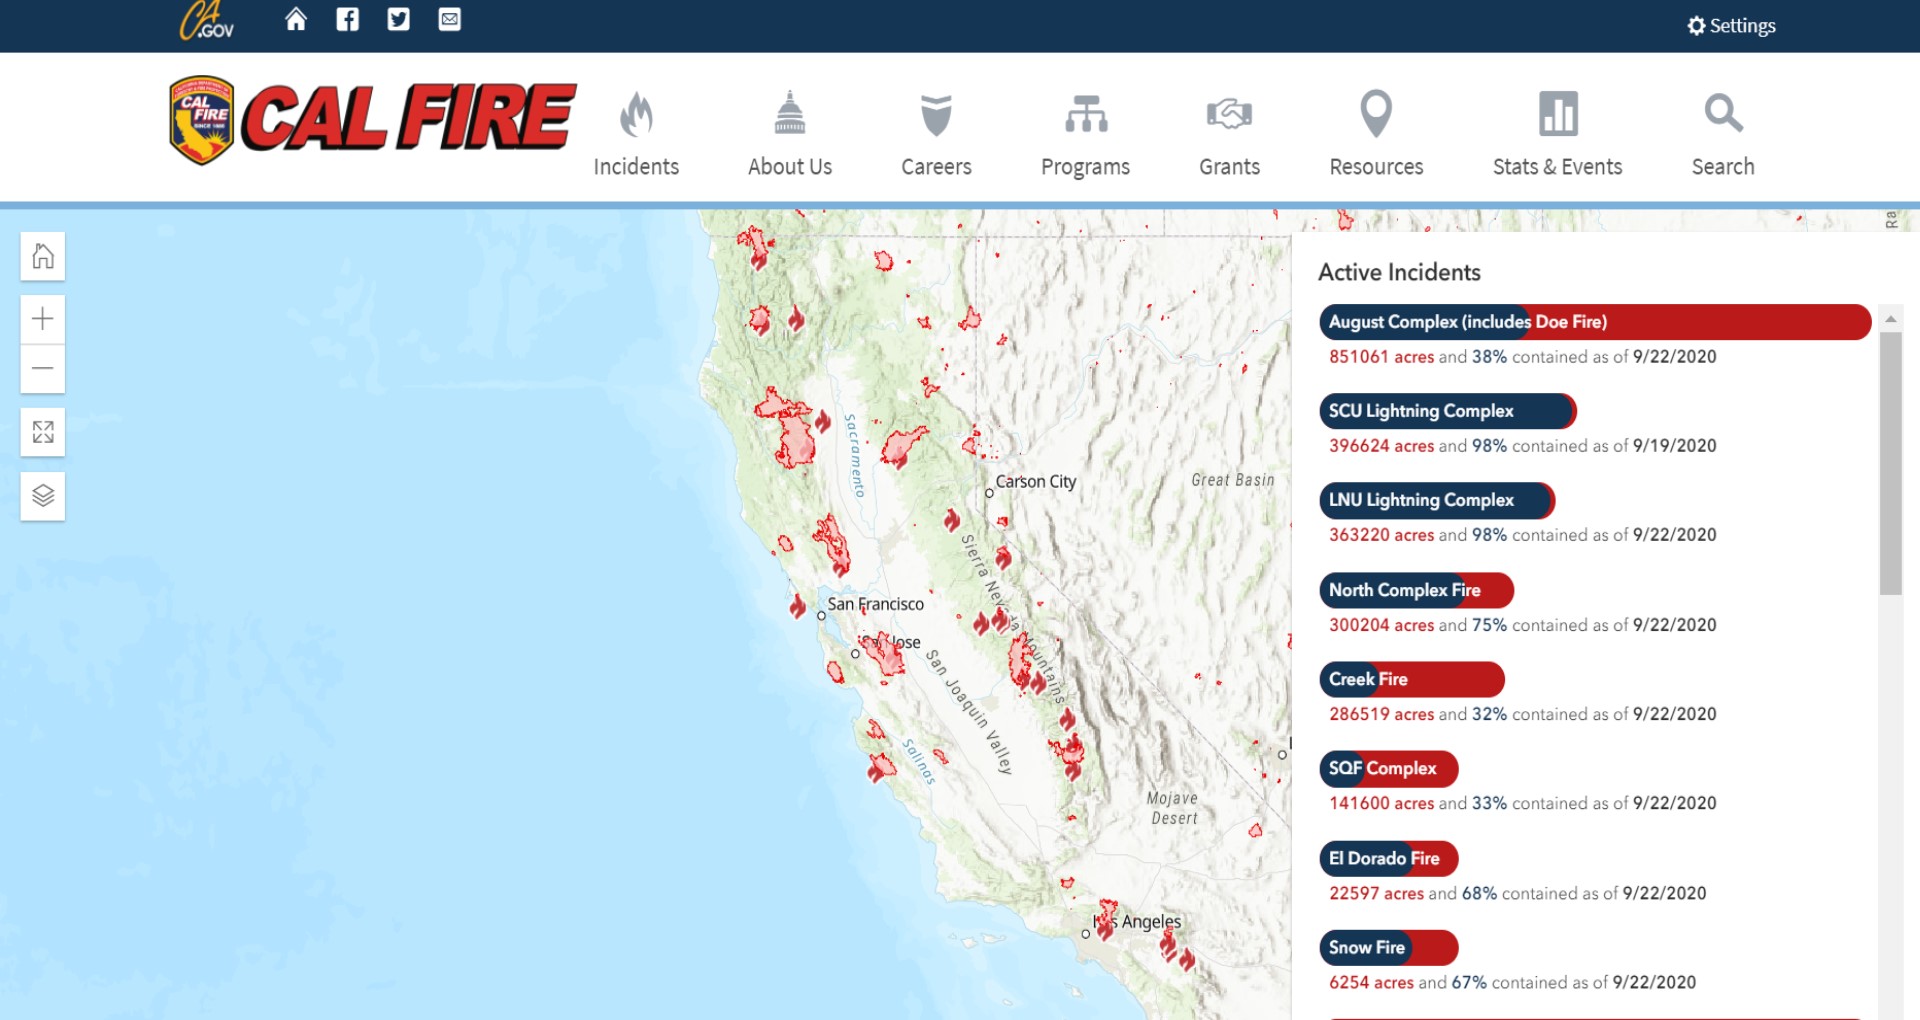
This live map has served as a useful public resource during wildfires in California.
“The fire that is burning in the Santiam Valley in Oregon, for example, went overnight from 190 hectares to 53,000," said HERE marketing manager Alexander Osaki.
“You're talking about a map that is changing – in some cases – literally minute by minute. Being able to process that kind of information and being able to understand how that relates to the administrative areas, how that relates to the agencies you need to contact and how you need to move people around is incredibly important."
These live maps combining data sets such as HERE Points of Interest (POIs) with USGS maps, along with other information such as satellite imagery, are increasingly common.
Maps used in disaster response have evolved from static maps produced from one source to real-time, constantly changing maps that combine many datasets.
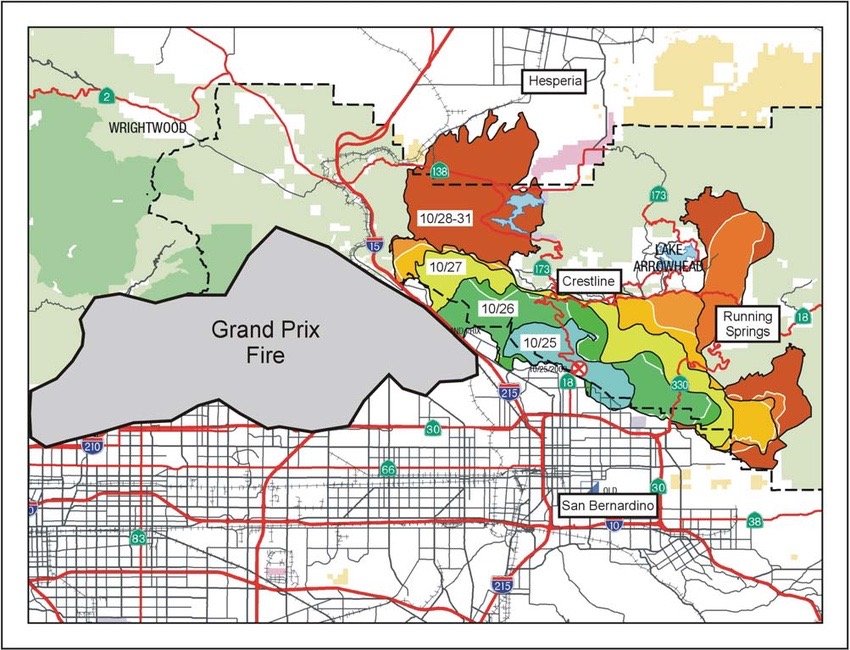
Not so long ago, emergency services depended on static maps like this one during natural disasters. Image credit: Research Gate
They may once have viewed as niche or 'nice-to-have' tools but now serve as an important public resource.
After all, it is much easier to communicate to the public why they need to leave a certain area if they can see on a map that fire is heading their way.
The public can use maps like this to make informed decisions.
A map created by data from the agency Four Twenty Seven showing which parts of the US are prone to which kinds of weather extremes was recently published in the New York Times. It is hoped that this method of visualizing and personalizing the effects of climate change will bring it home for more people. Four Twenty Seven is a company that assesses climate risk for financial markets.
And increasingly, maps are at the center of the authorities' decision-making in times of crisis.
The future of emergency response
Compared to the publicly available California Fire Department map, those maps used by firefighters and other emergency services are usually more complex and focused on professional use cases.
However, the same principle is at work: location data from different datasets is brought together to create a real-time representation of reality.
“This is a new opportunity for governments looking to manage incidents in real time," Alexander said. “And for companies or agencies looking at how we can use location data to improve the way that we respond to emergencies."
The challenge now is finding better ways of integrating different sources of information.
Mapmakers and application developers need to find not only the best data but also the best ways of combining and visualizing it.
“Our ability to do that has grown exponentially in the last in the last decade," he added.
Disaster maps can also be used to predict the future, and plan accordingly. Feeding weather data and including wind patterns and satellite data into the mix can help to show where fires or floods might move to next.
They can also be used to track changes over time, such as this one created by the US Forest Service to map spatial and temporal changes in fire frequency in the forests of California.
Armed with these analytic tools, authorities can potentially move from response towards preparation and prevention.
If wildfires continue to get worse, preparation and prevention are going to be increasingly important.
Do you need to build a digital version of reality for disaster response, and unlock the power of location intelligence? Find out more here

Have your say
Sign up for our newsletter
Why sign up:
- Latest offers and discounts
- Tailored content delivered weekly
- Exclusive events
- One click to unsubscribe